Identifying health patterns through maps
Where we live matters to our health, and we can use maps to identify geographic patterns in how long and how well we live.
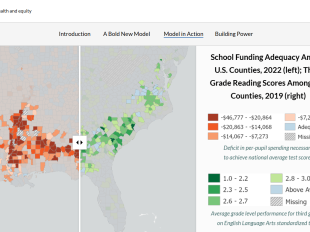
County Health Rankings & Roadmaps (CHR&R) data can be used to create maps that illustrate patterns in health factors and outcomes. These maps can also be used to advocate for the improvement of the health of all people by communicating where opportunities or barriers exist for people to reach their full health potential.
CHR&R collaborated with ArcGIS Living Atlas of the World, a collection of online geographic information, to offer CHR&R data from 2018 to 2023 in a format that can be used to create maps. Maps are created using layers of data. For example, a U.S. map might contain a layer of county boundaries with a layer of state boundaries on top. Each layer has an associated data table with information on the locations included. For CHR&R data, the tables contain county names, codes and measures of health outcome and health factors.
Living Atlas provides interactive web maps and applications that allow anyone to view how others are visualizing place-based data. ArcGIS users can combine Living Atlas content with their own organization’s data to create new maps and applications to describe patterns and relationships in the data.
CHR&R data have highlighted geographic patterns in several instances including in our interactive map on the gender pay gap. The map allows readers to see where the gap is widest and to click on any county to view the local numbers. Living Atlas also used CHR&R data in a map called “Where is there a national income disparity for Black households?” The map compares the median household income for Black households with the national median income in the U.S.
To find CHR&R data in ArcGIS Living Atlas, navigate to the Living Atlas website and type “County Health Rankings.” You will find CHR&R data layers grouped by publication year. These have been viewed more than 1.2 million times since 2018. CHR&R layers are also included in more than 30 web maps that show national, state and county levels.


