
2019 County Health Rankings Key Findings Report
Introduction
A Call to Action
This report is a call to action for leaders, residents, and community changemakers to take these national findings, dig into local data to better understand the health of your own community, and implement strategies to create communities where everyone has a fair and just chance to lead the healthiest life possible. Throughout the report you will find references to specific local data resources, evidence-informed strategies, and examples of other communities that are working to close gaps in opportunity.
By ranking the health of nearly every county in the nation, County Health Rankings & Roadmaps (CHR&R) illustrates how where we live affects how well and how long we live. CHR&R also shows what each of us can do to create healthier places to live, learn, work, and play – for everyone. This year highlights an important element that shapes how well and how long we live: secure, affordable housing.
Summary of Key Findings
- Across the U.S., more than 1 in 10 households (11%) spend more than half of their income on housing costs (severe housing cost burden). Among those who own their home, housing cost burden has decreased in the past decade. At the same time, there has been no improvement in the rates among renters. Housing cost burden remains substantially higher among renters than owners, particularly for households with low incomes.
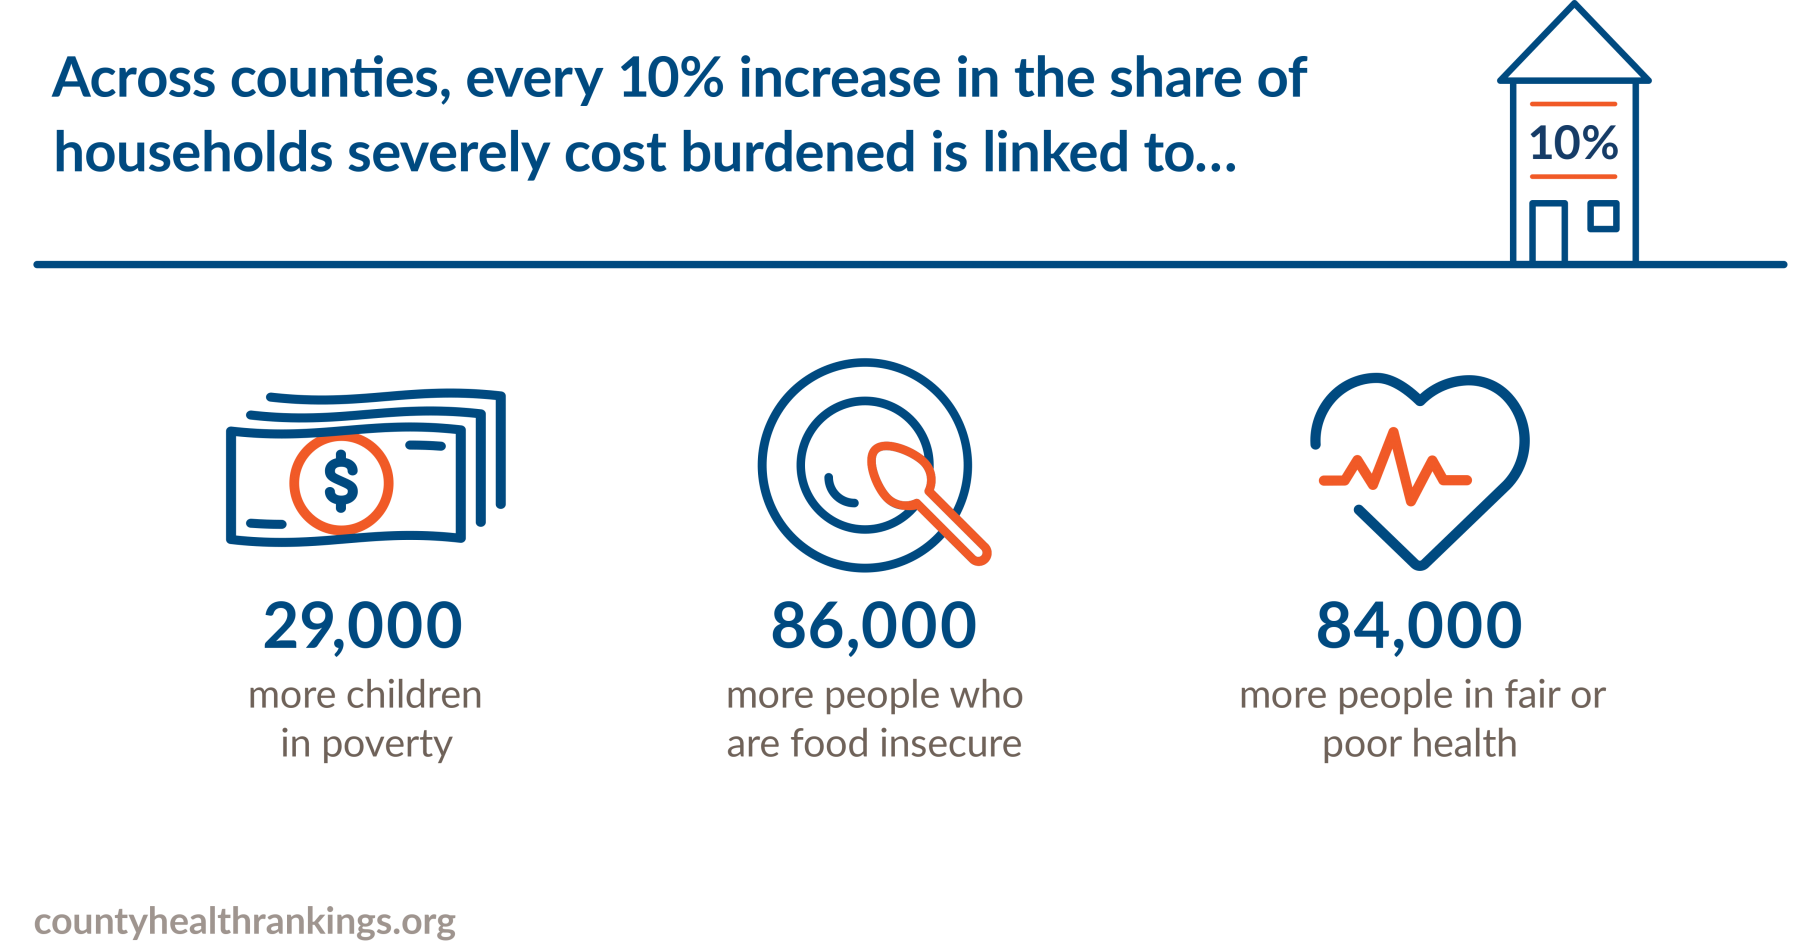
- Severe housing cost burden affects health and is linked to barriers to living long and well. Across counties, increases in the share of households severely cost burdened are associated with more food insecurity, more child poverty, and more people in fair or poor health.
- More segregated counties have higher rates of severe cost burden, for both White and Black households. However, Black residents face greater barriers to opportunity and health than White residents. Nearly 1 in 4 Black households spend more than half of their income on housing.
- Owning a home can, over time, help build savings for education or for other opportunities important to health and future family wealth. In large urban and smaller metro counties, the vast majority of households headed by Whites own their home, while more than half of households headed by Blacks are renters, rather than homeowners. In the past decade, trends in homeownership rates have changed little on average, though gaps among racial/ethnic groups are widening.
Our Homes, Our Communities, Our Health
What's Happening in Your State?
See how housing is impacting health in your state by exploring our 2019 State Health Reports.
The County Health Rankings show that meaningful gaps persist in health outcomes among counties across the U.S. in large part because of differences in opportunities for health. As the Rankings model to the right illustrates, health outcomes are shaped by a range of factors that are heavily influenced by where we live – including health behaviors, clinical care, physical environment, and social and environmental factors. This year we focus on one such factor: our homes.
Our homes, and those of our neighbors, play a critical role in shaping our health and the health of the whole community. When our homes are near quality schools and good jobs, it’s easier to get a quality education and earn living wages. When people live near grocery stores where nutritious food is available and affordable, eating healthy is easier. Green spaces and parks encourage active lifestyles. By contrast, inside our homes things like lead, mold, smoke, and other toxins can make us sick. And when too much of a paycheck goes toward the rent or mortgage, it makes it hard to afford the doctor, cover utility bills, or maintain reliable transportation to work or school. Owning a home can help build savings, providing stability and wealth over time.
Our collective health and well-being depend on building opportunity for everyone. Yet, across and within counties there are stark differences in the opportunities to live in safe, affordable homes, especially for people with low incomes and people of color. These differences emerge from discrimination and institutional racism in the form of long-standing, deep-rooted and unfair systems, policies, and practices such as redlining, restrictive zoning rules, and predatory bank lending practices that reinforce residential segregation and barriers to opportunity. As a result, we consistently see worse health outcomes for people with low incomes and people of color. We cannot thrive as a nation when the factors that contribute to good health are available to some, but denied to others.
This report explores the intersection of place and health and focuses on how our homes contribute to other factors that matter for good health. You will find discussion of:
- Housing affordability across the nation.
- Housing cost burden and community conditions.
- Insecure housing and homelessness.
- Health and housing in counties of long-standing segregation.
A Closer Look at Housing Affordability
There is a strong and growing evidence base linking our homes to our health. As housing costs have outpaced local incomes, particularly for low-wage workers, families not only struggle to find and stay in safe, secure homes, but also face difficult trade-offs in meeting other basic needs. General guidance suggests that housing costs should not exceed 30% of monthly household income. When too much of a paycheck goes to paying the rent or mortgage, this housing cost burden can force people to choose among paying for other essentials such as utilities, food, transportation, or medical care. And as housing costs rise, so does the chance of becoming homeless, especially for families with low incomes and household budgets that are already strained.
Key Findings
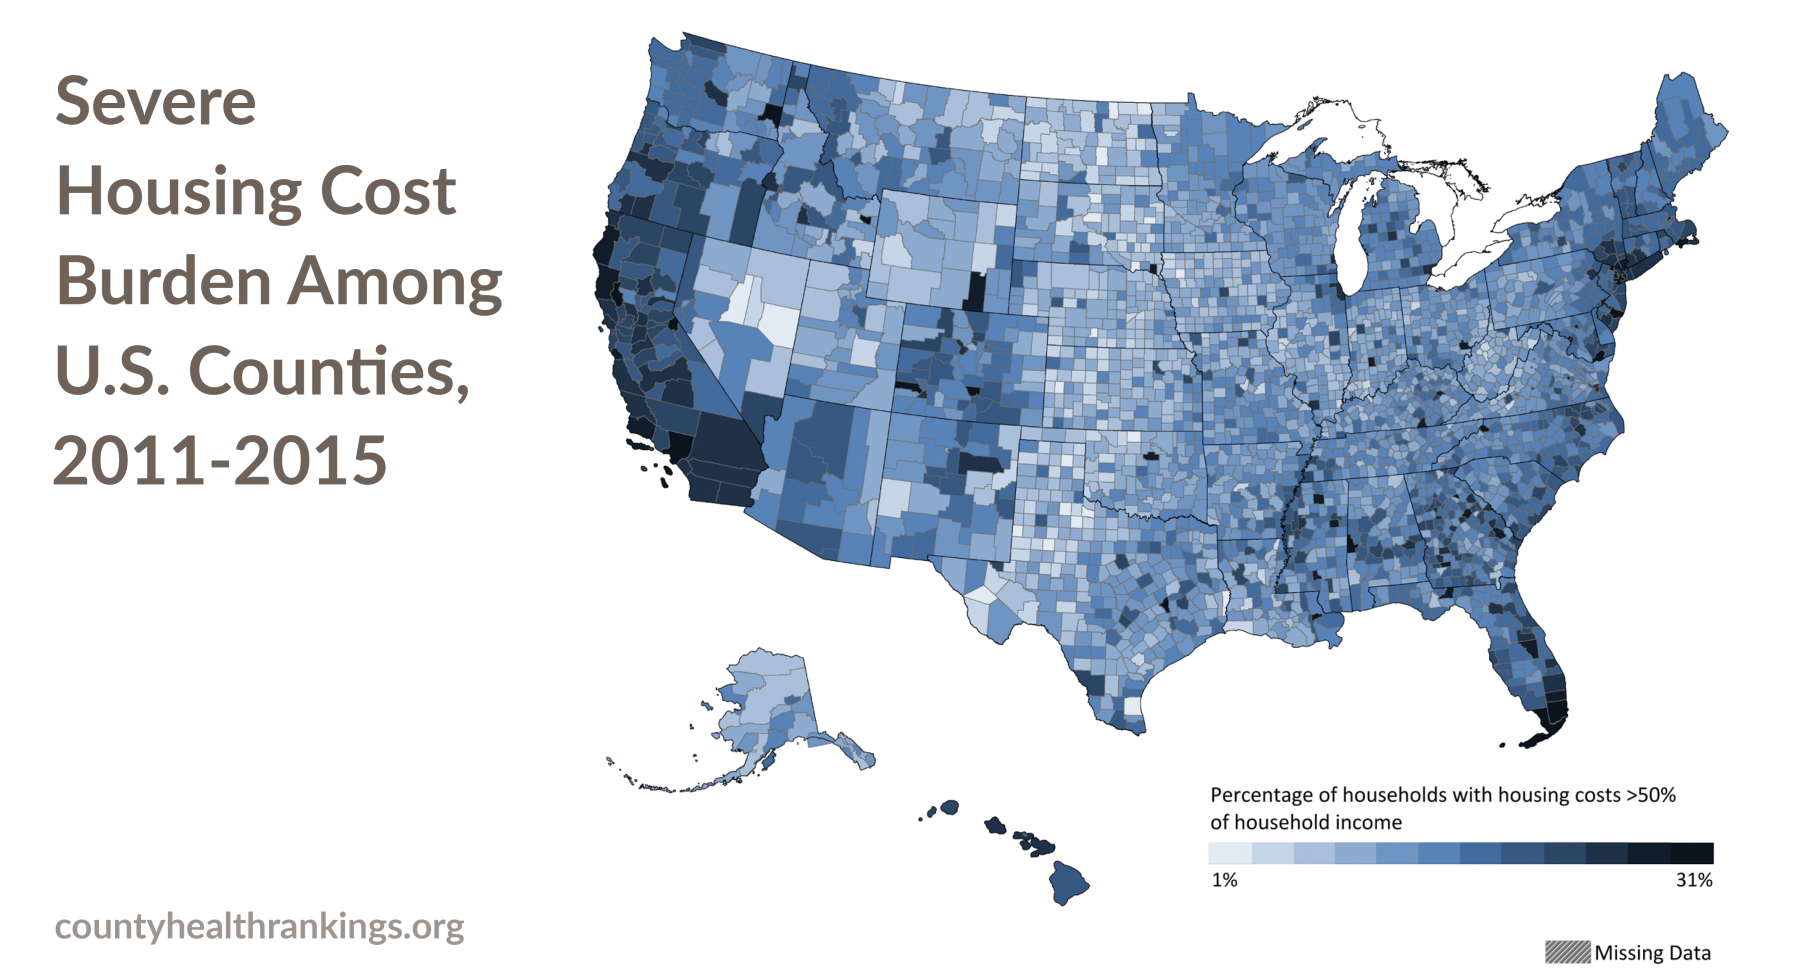
- Across the U.S., more than 1 in 10 households (11%) experience severe housing cost burden (paying more than 50% of household income on housing). The rate of severe housing cost burden among counties ranges from 1% to 31% of households.
- On average, severe housing cost burden is highest in large urban metro counties and lowest in rural counties.1
- Since 2006-2010, when a real estate crisis affected more than half of U.S. states, severe housing cost burden has decreased in large urban metro counties. However, half of all rural counties experienced an increase in severe housing cost burden since the housing crisis of
2006-2010.
Housing Cost Burden is measured as the percentage of households that spend more than 30% of their income on housing costs.
Severe Housing Cost Burden is the percentage of households that spend more than 50% of their income on housing costs. To learn more about our measure of Severe Housing Cost Burden, visit countyhealthrankings.org/housingburden and find your county’s data in the Additional Measures section of your county snapshot.
1 See Technical Notes below for definition of county level of urbanization.

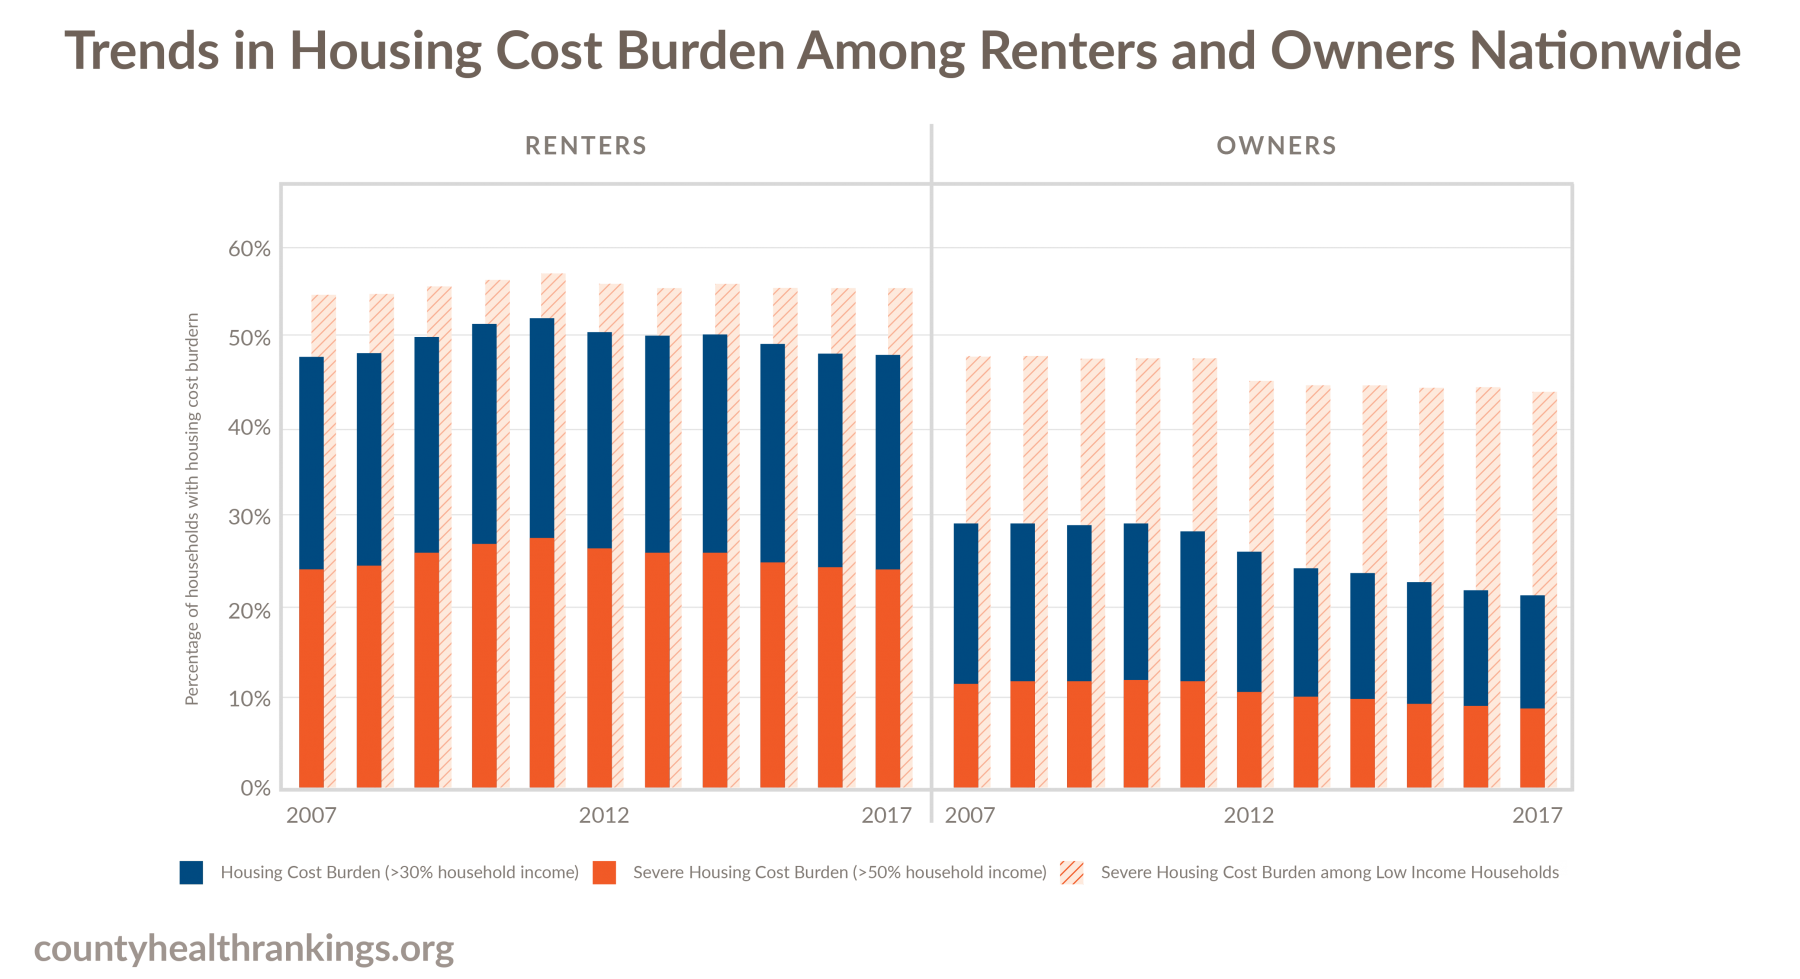
Recent data show that of the approximately 120 million U.S. households,2 most own a home (64% or 76.2 million), while fewer households rent (36% or 42.8 million). On average, household incomes for renters are lower than for owners, and renters tend to have very little savings and wealth. With less income to draw on, renters are disproportionately burdened by housing costs compared to homeowners. The graphic above shows the share of all households that spend more than 30% (blue bar), or more than 50% (orange bar) of their income on housing costs among renters and owners, each year over the past decade. Housing cost burden is also worse for those with the lowest incomes. The share of low-income households that spent more than half of their income on housing costs in this same time period can be seen with the hatched bars.
Key Findings
- The percentages of housing cost burdened or severely housing cost burdened homeowners has decreased over the past decade.
- Among renters, there has been no indication of improvement in the percentage of housing cost burdened or severely housing cost burdened households. Housing cost burden remains substantially higher among renters than owners.
- One in 4 renters spends more than half of their income on housing costs. Nearly 1 in 2 renters spends more than 30% of their income on housing costs.
- Low-income renters and homeowners3 are the most likely to be housing cost burdened, showing little improvement in the past decade. More than half of all low-income renters pay more than 50% of their income on housing costs.
2 Households are defined as all people living in a housing unit. Members of a household can be related or unrelated.
3 Low-income renters and homeowners are households earning less than 150% of the federal poverty level (FPL). In 2017, a household of four at 150%FPL earned $36,900.
Housing Cost Burden and Community Conditions
In communities where housing costs rise faster than local incomes, households struggle to acquire and maintain adequate shelter, often to the detriment of other social and economic factors that enable us all to be healthier.
Key Findings
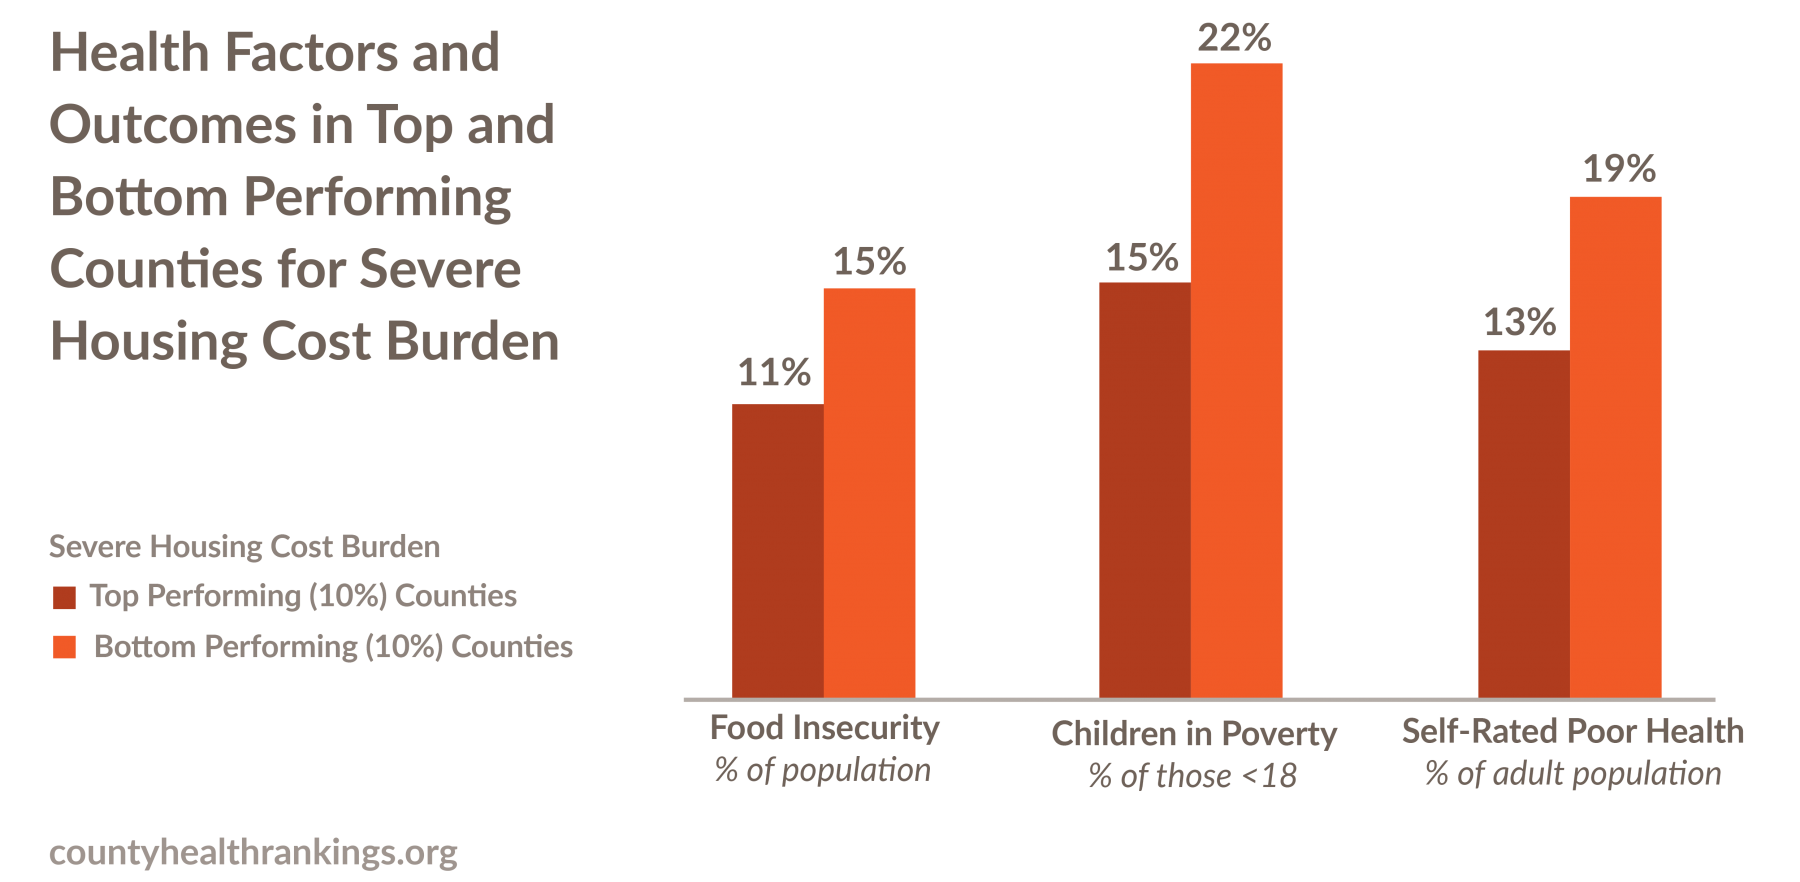
- Severe housing cost burden affects households across the nation, with as many as 800,000 households paying more than half of their income on rent or mortgage in some counties.
- After accounting for demographic factors,4 the counties with the highest and lowest housing cost burden differ remarkably in rates of child poverty, food insecurity,
and self-rated fair or poor health. - Across these communities, with every increase in the share of households severely housing cost burdened, there are greater barriers to living long and well, such as more people who are food insecure, more children in poverty, and more people reporting poor or fair health.
Data sources: Comprehensive Housing Affordability Strategy; Small Area Income and Poverty Estimates; Map the Meal Gap; Behavioral Risk Factor Surveillance System
4 Analyses adjusted for median household income and rurality of counties (please see Technical Notes below for more detail).
Columbia River Gorge, Oregon

In the vast rural area of the Columbia River Gorge, two counties—Hood River and Wasco—are among the top five most expensive counties to live in Oregon. Residents earning the minimum wage would have to work nearly two full-time jobs to afford a two-bedroom apartment and still have some money to spare for other basic essentials. To increase affordable housing in the region, the Mid-Columbia Housing Authority (MCHA) is utilizing state and federal funding not only to develop housing, but also to equip the new homes with supportive services for the more than 1,100 households receiving Housing Choice Vouchers or residents in affordable housing. Community health workers serve as resident service coordinators and a community-based Housing Team develops comprehensive policy recommendations for expanding affordable housing opportunities. Learn more at rwjf.org/prize
Insecure Housing and Homelessness
Call To Action
- Explore how national and state findings on stable and affordable homes are playing out in your community. Find your county snapshot (enter your county in the search box at the top of this page) and review your data.
- Check with your local health department, housing authority, or county government for data on affordable housing and homelessness, including data by race and income.
- Work with local, statewide and regional partners in community development corporations and financial institutions, hospital systems, government planning and health services, and others.
- Focus on strategies that increase opportunities for low-income households and families at risk of homelessness to be healthy, such as safe and affordable housing in neighborhoods with opportunities for a good education, living wage jobs, and access to healthy foods and quality clinical care.
Many households are just one unforeseen event – an illness, job loss, financial crisis, or even a drop in hours at work – from losing their home. The risk for homelessness is especially high for low-income families spending more than half of household income on housing costs. A dataset from The Eviction Lab that measures insecure housing, forced moves, and poverty in the U.S. estimates that, in 2016, nearly 900,000 households faced evictions. That same year, more than 900,000 households also began the foreclosure process. Some of these families end up without a place to live. Though homelessness is difficult to measure, according to the U.S. Department of Housing and Urban Development, the overall number of people experiencing homelessness was approximately 553,000 in 2018.
Families that face insecure housing, forced moves, or homelessness are more likely to experience poor mental or physical health and preventable hospitalizations. For children in these families, experiencing homelessness can also be harmful to brain and body function and development, with lifelong and cumulative negative health outcomes for the child, the family, and the community.
Key Findings
- Families are considered “at risk” for homelessness if they are low-income and spend more than half of their household income on housing. Recent data suggest that in large urban and smaller metro counties where homelessness is more common, 6.7 million households – nearly 1 in 10 – could be considered “at risk” for homelessness.5
- Even among the healthiest of these counties (top 10% performers in measures of length and quality of life), as many as 1 million households (or 10% of households) could be considered “at risk” for homelessness.
5 Households considered “at risk” for homelessness are severely housing cost burdened and earn 30% or less of the area median family income.
Chelsea, Massachusetts

Just outside Boston, in Chelsea, Massachusetts, the community knows that health and housing are inextricably linked. Through the Boston Foundation’s Health Starts at Home initiative, the MGH Chelsea HealthCare Center screens medical patients for housing instability and refers those who are most at risk of homelessness to CONNECT, a multi-agency one-stop shop that helps people secure stable housing, gain skills, find jobs, and manage finances. In 2018 alone, CONNECT helped over 450 clients get back on their feet by stabilizing their income and/or housing. The Neighborhood Developers (TND), where CONNECT is based, is also leading the charge to build affordable housing in Chelsea. The Box District is one example: a 248-unit development where half of the units are designated as affordable. With 395 affordable housing units already developed, TND wants to continue its momentum by adding 400 more in the next seven years. Beyond building new homes, Chelsea is focused on the preservation, rehabilitation, and maintenance of existing affordable housing through an Affordable Housing Trust Fund. Learn more at rwjf.org/prize.
Housing at the Intersection of Place, Race, and Health
Impacts of Discriminatory Policies and Practices on Housing and Health
To illustrate how our homes and neighborhoods impact access to opportunity and health, we took a closer look at large urban and smaller metro counties, areas with long-standing segregation of Black and White residents. Residential segregation has resulted in large part from a long history and continuation of discriminatory policies and practices selectively restricting occupancy in neighborhoods reserved for Whites and denying housing loans in ‘redlined’ neighborhoods, often where mostly Black residents live. While most explicit policies and practices have been outlawed, racial discrimination persists in many forms, such as unfair bank lending and realtor practices that sort prospective homebuyers into certain neighborhoods based on their race, and zoning laws that prohibit lower cost multi-family housing. Additionally, the impacts of once legal discriminatory policies and practices exist today. Past and current discrimination coupled with disinvestment in schools, businesses, and public services limit the opportunities for people of color to rent or own an affordable home in neighborhoods with good schools, living wage jobs, green spaces, and safe environments. Poor health is more common in places that are segregated from opportunity. Decades of research shows that separating communities by race and ethnicity, income, and other categories is a fundamental cause of health disparities in the U.S.
How Disparities in Homeownership Limit Opportunity
Owning a home can, over time, help build wealth and savings for education or for other opportunities that are important for health and future wealth for families. Today, most households across the U.S. (approximately 64%, or 76.2 million) own a home – a result in part from policies and tax incentives designed to promote the purchase of housing in some communities. However, not all households have had a fair chance to pursue homeownership and the potential to accrue equity from owning a home. Black homeownership rates have hovered at a level well below that of Whites, remaining virtually unchanged since 1968, when passage of the Fair Housing Act made housing discrimination illegal.
Homeownership is the percentage of households that own a home. To learn more about our measure of homeownership, visit countyhealthrankings.org/homeownership and find your county’s data in the Additional Measures section of your county snapshot.

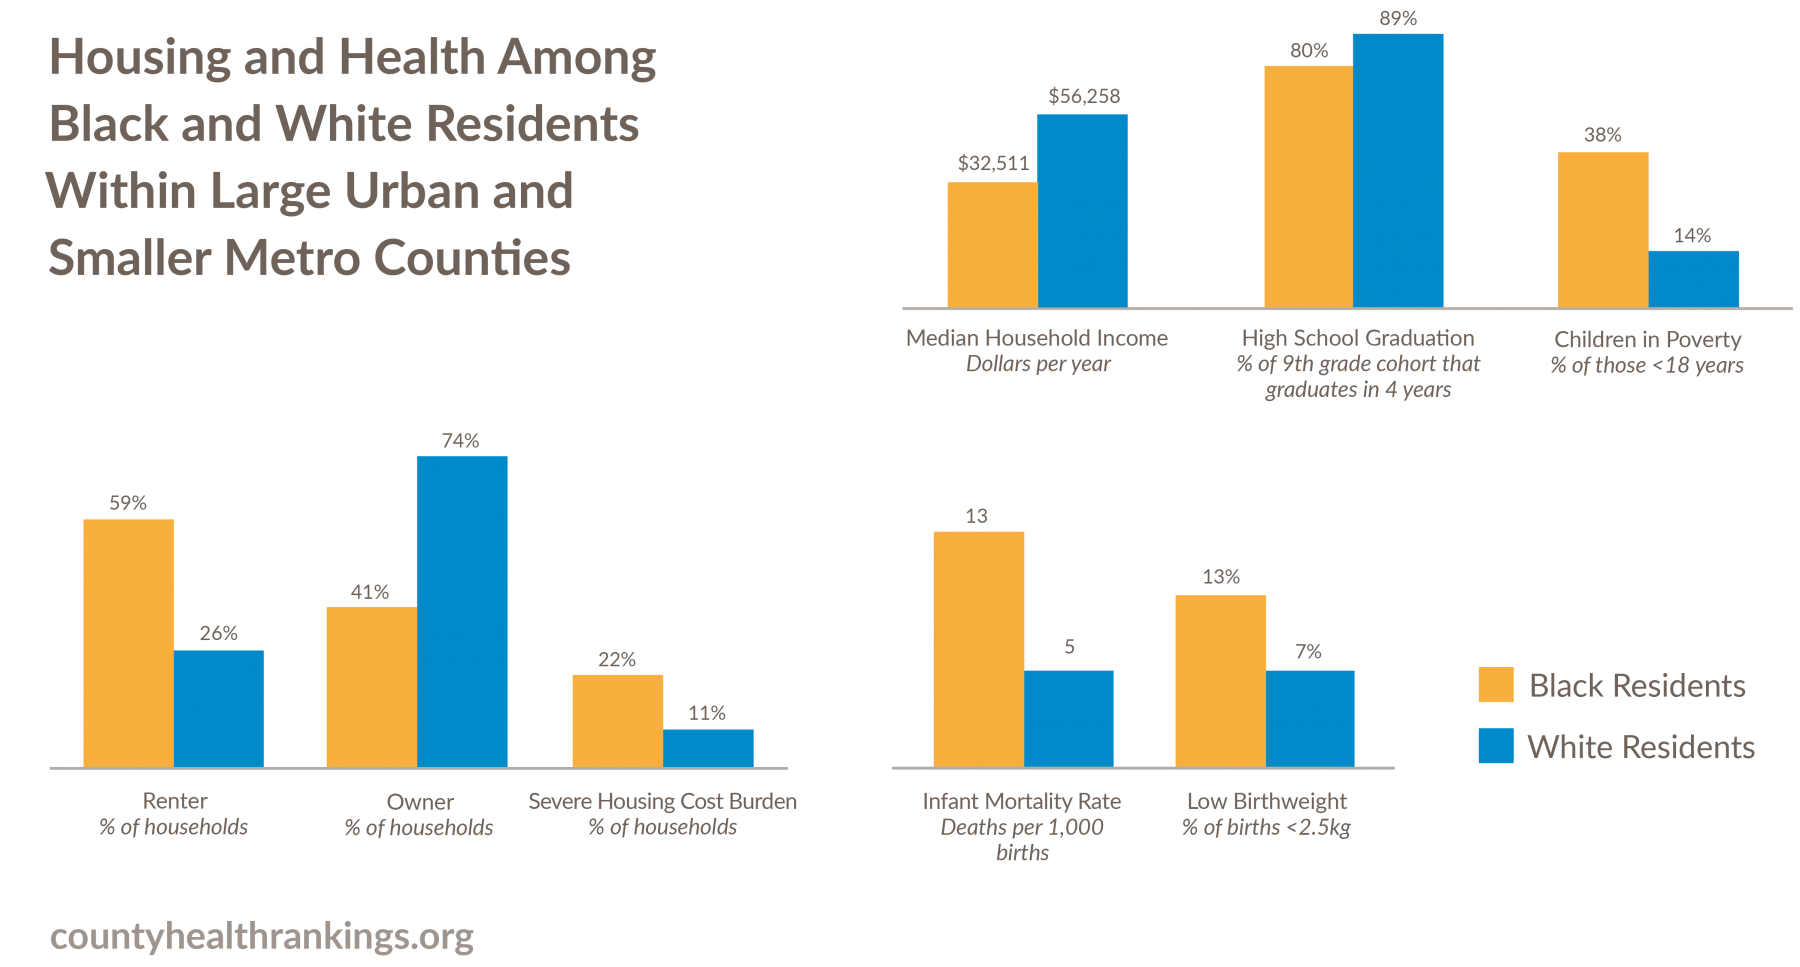
Key Findings Among Large Urban and Smaller Metro Counties
- The vast majority of households headed by Whites are homeowners, while households headed by Blacks are more likely to rent, with fewer than half being homeowners.
- The median income among households headed by Whites is $56,000, and more than 1 in 10 are severely housing cost burdened. In contrast, the median income among households headed by Blacks is $33,000 and these households are twice as likely to be severely housing cost burdened compared to White-headed households. Nearly 1 in 4 households headed by Blacks spends more than half of their income on housing.
- Black residents face greater barriers to opportunity and health than White residents. Black children, youth, and adults have higher rates of child poverty, poorer birth outcomes, higher rates of premature death, and lower high school graduation rates than do White residents. For example, 38% of Black children live in poverty compared to 14% of White children, and infant mortality rates for babies born to Black mothers are more than twice that of babies born to White mothers.
- In the past decade, homeownership rates have changed little on average. However, gaps among racial/ethnic groups are widening. Households headed by Whites have consistently had the highest rates of homeownership. These homeownership rates are 20-30% higher than for people of color.
Data sources: Comprehensive Housing Affordability Strategy; Small Area Income and Poverty Estimates; American Community Survey; National Center for Health Statistics; EDFacts; and state sources.
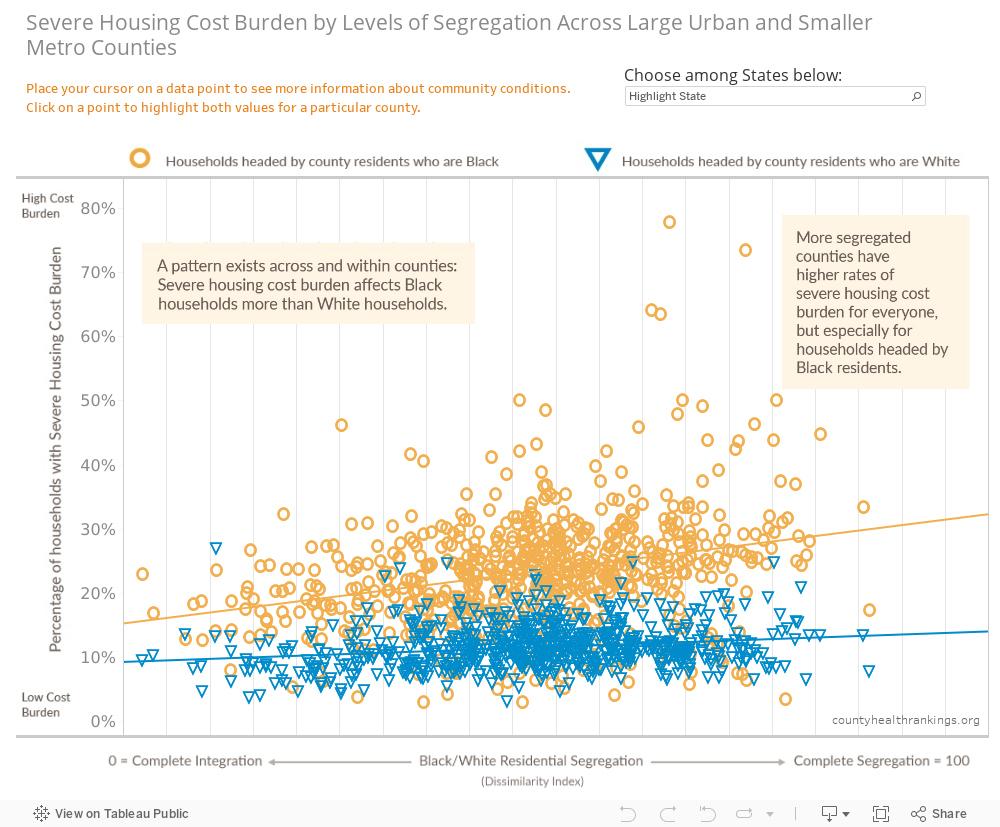
More Segregated Counties have Higher Housing Cost Burden
The graphic below illustrates the relationship between severe housing cost burden and residential segregation for Black and White households in large urban and smaller metro counties. The percentage of severely housing cost burdened households headed by Blacks (circles) and Whites (triangles) can be seen across the range of counties with varying levels of residential segregation. The orange and blue lines show the nature of the relationship between severe housing cost burden and residential segregation across counties for households headed by Blacks or Whites, respectively.
Key Findings Among Large Urban and Smaller Metro Counties
- Places with higher levels of residential segregation have higher rates of severe housing cost burden for households headed by White or Black residents.
- In the most segregated counties (top 10%), on average, 26% of households headed by Blacks and 12% of households headed by Whites are severely housing cost burdened, while in the least segregated counties (bottom 10%) the rates are 18% and 9%, respectively.
Residential segregation is measured using the index of dissimilarity, where higher values indicate greater residential segregation between Black and White county residents. The residential segregation index ranges from 0 (complete integration) to 100 (complete segregation). To learn more about our measure of residential segregation, visit countyhealthrankings.org/segregation and find your county’s data in the Additional Measures section of your county snapshot.
24:1 Community, Missouri
The 24:1 Community in Missouri includes a nationally-recognized community development effort created by Beyond Housing to address the fundamental challenges within the 24 municipalities in the Normandy school district in North St. Louis County. Beyond Housing is working to boost homeownership in 24:1 in several ways. Its nonprofit 24:1 Community Land Trust uses a variety of subsidies to make homeownership affordable for people who would otherwise be locked out of the market. Residents own their homes, but lease the land, which is owned by the trust. The houses stay affordable because the trust controls the price owners receive when they sell. Buyers receive financial and homeownership counseling before they buy and supportive services after they sign the contract. With its partners, Prosperity Connection, a nonprofit financial education provider, and Red Dough, a lender that offers lower-interest alternatives to predatory payday loans, Beyond Housing has established a “Wealth Accumulation Center” in downtown Pagedale. The center offers free financial coaching and classes on homebuying, credit repair, college and retirement savings, and other topics. There are early signs of success with increased stability for 98 percent of Beyond Housing families with school-aged children. Learn more at rwjf.org/prize.
What can work to create and preserve stable and affordable homes that can improve economic and social well-being for residents?
A comprehensive, strategic approach that looks across a community and multiple sectors and draws from a range of evidence-informed strategies is needed to create and preserve stable, affordable homes in local communities. The way forward requires policies, programs, and systems changes that respond to the specific needs of each community, promote inclusive and connected neighborhoods, reduce displacement, and enable opportunity for better health for all people.
An effective approach will include efforts to:

Make communities more inclusive and connected, such as:
- Inclusionary zoning
- Civic engagement, including youth, in public governance and in community development decisions
- Fair housing laws and enforcement
- Housing mobility programs
- Mixed income development
- Access to living wage jobs, quality health care, grocery stores, green spaces and parks, and public transportation systems
Facilitate access to resources needed to secure affordable housing, particularly for low- to moderate-income families, such as:
- Housing Choice Vouchers for low- and very low-income households
- Housing trust funds
Address capital resources needed to create and preserve affordable homes, particularly for low- to moderate-income families, such as:
- Acquisition, management, and financing of land for affordable housing
- Tax credits, block grants, housing trust funds, and other government subsidies or revenues to advance affordable housing development
- Zoning changes that reduce the cost of housing production
Provide services and supports to increase housing stability and reduce the risk of homelessness by ensuring basic needs are met and improving access to social services, such as:
- Rapid re-housing programs, supportive housing, service-enriched housing, and rental assistance
- Eviction prevention strategies
- Income supports, like living wage laws, paid family leave, or Earned Income Tax Credits
Additional Resources
- Technical Notes and Glossary of Terms
- 2019 County Health Rankings: Ranked and Additional Measures Sources and Years of Data
Credits
Recommended citation
University of Wisconsin Population Health Institute. County Health Rankings Key Findings 2019.
Lead Authors
Marjory Givens, PhD, MSPH
Keith Gennuso, PhD
Amanda Jovaag, MS
Julie Willems Van Dijk, PhD, RN, FAAN
Sheri Johnson, PhD
This publication would not have been possible without the following contributions:
Research Assistance
Courtney Blomme, RD
Elizabeth Pollock, PhD
Matthew Rodock, MPH
Anne Roubal, PhD
Joanna Reale
Alison Bergum, MPA
Kiersten Frobom
Lael Grigg, MPA
Bomi Kim Hirsch, PhD
Jessica Rubenstein, MPA, MPH Jessica Solcz, MPH
Outreach Assistance
Kate Kingery, MPA
Kitty Jerome, MA
Kate Konkle, MPH
Raquel Bournhonesque, MPH
Ericka Burroughs-Girardi, MA, MPH
Aliana Havrilla, MPIA
Joe Hinton, MA
Janna West Kowalski, MS
Karen Odegaard, MPH
Justin Rivas, MPH, MIPA
Attica Scott, MS
Carrie Carroll, MPA
Olivia Little, PhD
Communications and Website Development
Burness
Forum One
Kim Linsenmayer, MPA
Matthew Call
Komal Dasani, MPH
Kelsie Fye
Lindsay Garber, MPA
James Lloyd, MS
Data
Centers for Disease Control
and Prevention
National Center for Health Statistics
Robert Wood Johnson Foundation
David Adler, DrPH, MPA
Abbey Cofsky, MPH
Amy Gillman, MM
Giridhar Mallya, MD, MSHP
Jessica Mark, MPH
Joe Marx
Donald Schwarz, MD, MPH
Kathryn Wehr, MPH
Scientific Advisory Group
Pat Remington, MD, MPH (Chair)
Renee Branch Canady, PhD, MPA Jim Chase, MHA
Maggie Super Church, MSc, MCP Tom Eckstein, MBA
Rebecca Tave Gluskin, PhD
Kurt Greenlund, PhD
James Holt, PhD, MPA
Carolyn Miller, MA, MS
Ana Diez Roux, MD, PhD
Steven Teutsch, MD, MPH
Trissa Torres, MD, MSPH, FACPM