Tracking COVID-19 in Near Real Time: Open-Source Data Tool Shows the Health, Social, and Economic Effects of COVID-19
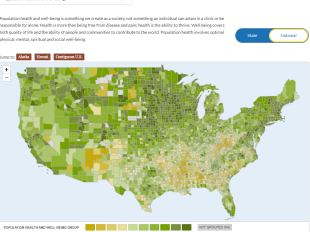
Since COVID-19 struck the United States, there’s been a constant call for real-time, local-level data. The University of Chicago Center for Spatial Data Science’s US COVID Atlas is helping to answer that call.
This interactive, open-source data tool offers invaluable insights for users looking to gain a deeper understanding of the novel coronavirus’s spread across the country and within their own county and state. Updated daily, the Atlas allows users to compare county-level COVID-19 data and see how the virus has spread over time, including showing emerging and persistent hotspots. Users can also examine overlays of Native American tribal communities, hypersegregated cities, and communities in the Black Belt in the South to paint a clearer picture of places that share a greater burden of the pandemic.
These data on COVID-19 cases and viral spread is only part of the story. At the County Health Rankings & Roadmaps, we know that there are stark differences in health and opportunity based on where you live—particularly for those with lower incomes, in rural communities, and in communities of color. The coronavirus pandemic has brought these inequities front and center.
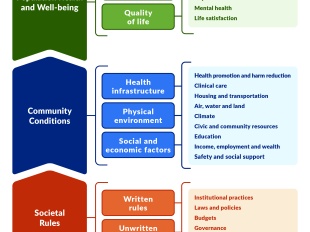
To better understand where we are, we need to understand where we’ve been and what led us here. While the County Health Rankings do not measure coronavirus cases nor risk of the virus spreading in communities, certain county-level measures do offer helpful context about the community conditions that were at play before the first case of COVID-19 appeared in the United States. The Atlas features key County Health Rankings measures that provide this context—from children in poverty to residential segregation to access to medical care.1
By seeing the social and economic conditions that influence health alongside near real-time COVID-19 data, state and local leaders can use the US COVID Atlas as they move through reopening phases, navigate their COVID-19 response and recovery, allocate resources, and tailor and implement strategies .
Watch the recording of our webinar on the US COVID Atlas to take a closer look at tool and learn more about bridging data with historical context.
1 County Health Rankings measures included in the US COVID Atlas: Community Health Factors: children in poverty, median household income, food insecurity, unemployment, uninsured, primary care physicians, preventable hospital stays, residential segregation (Black/White), and severe housing problems; Community Health Context: percentage of population ages 65 and older, adult obesity, diabetes prevalence, adult smoking, excessive drinking, and drug overdose deaths; and Length and Quality of Life: life expectancy and self-rated health.


