
2020 County Health Rankings Key Findings Report
A Call to Action
This report is a call to action for leaders and community changemakers to take these national findings, lift up local histories and lived experiences, and dig into local data to better understand the health of your own communities. Working together in your community, you can implement strategies to create places where everyone has a fair and just chance to lead the healthiest life possible. Throughout the report, you will find references to specific local data resources, evidence-informed strategies, guidance on taking action, and examples of communities that are working to close the gaps in opportunity. Supporting materials (such as data tables) are available at countyhealthrankings.org.
Introduction
Since the first release in 2010, the County Health Rankings have helped the nation understand that where you live matters for your health. Fair access to jobs, quality education, safe, affordable housing, proximity to greenspace, and transportation shape day-to-day life and long-term opportunities for good health. This year, with the 10th anniversary of the Rankings, we highlight signs of improvement and recognize the challenges that remain to create a fair and just opportunity for everyone to be as healthy as possible.
We take a careful look at counties among the least healthy and urge consideration of the context. Past and present forms of discrimination matter. There are multiple examples of laws and policies – some that started with the birth of the nation and whose effects are still felt today – that underlie current opportunities for health. For example, this can be seen in the failure to uphold laws and treaties, including the rights of Native people; in discriminatory practices in labor, housing, bank lending, and criminal justice; and in the disinvestment in local and regional economies.
We look at signs of hope among communities doing the hard work for a better tomorrow, recognizing that our actions today affect future generations. Too many children continue to live in poverty. This is a challenge for counties among the least healthy, and even counties among the healthiest in each state.
Often, it is necessary to look backward to understand how to move forward. By pairing data with an acknowledgment of history, we can work together to address the impacts of racism and discrimination. We can move toward healing and optimal health for all. We seek a future where everyone can thrive, no matter who you are, where you live, or how much money you have.
Summary of Findings
- Gaps in life expectancy remain. After a drop in life expectancy in recent years, signs indicate the overall national trend may be leveling off. Yet not all groups of people, everywhere, have experienced the same length of life trends. Among rural counties, more counties worsened than improved since the 2010 Rankings, and nationwide, racial and ethnic disparities in life expectancy persist. Progress is uneven: from the 2010 to 2020 Rankings, there have been gains in some of the key factors that impact health, including education and employment, while others, such as rates of children living in poverty and income inequality showed little progress.
- The past affects the present. The Rankings have shown that from one county to the next, stark differences persist in health and opportunity. This year, we take a closer look at counties that were among the least healthy in the 2010 Rankings. These counties are part of the Deep South, Appalachia, and Tribal Lands – each representing regions of the country with long histories of racism, disinvestment, and discrimination.
- There is work to be done. Counties among the least healthy saw gains in employment and insurance rates in recent years, though a wide gap remains, as the rest of the nation also improved.
- Even the healthiest counties can do better. Since 2010, the Rankings have identified counties performing well overall – that is, ranked at the top within their state. Yet, data show within these counties, obstacles to opportunity exist. Even in the top-ranked county of each state, challenges remain with income inequality and children living in poverty, disproportionately burdening children of color.
- Child poverty remains a formidable barrier to the health of our nation today and in the future. Recent trends show that while a small share of counties made progress post-recession, child poverty remains high in the vast majority of counties. Racial inequities in children living in poverty persist.
- The racial opportunity gap persists. While unemployment rates have declined for all racial and ethnic groups, income for American Indian and Alaska Native, Black, or Hispanic households have largely seen modest gains relative to Asian or White households. These modest gains have not translated into household incomes that keep pace with rising costs of living, such as housing, making it difficult for families with lower incomes to make ends meet and be healthy.
About County Health Rankings & Roadmaps
By ranking the health of nearly every county in the nation, County Health Rankings & Roadmaps (CHR&R) illustrates what we currently know when it comes to what is keeping people healthy or making them sick and shows what we can do to create healthier places to live, learn, work, and play. CHR&R brings actionable data, evidence, guidance, and stories to diverse leaders and residents to make it easier for people to be healthier in their communities. The Robert Wood Johnson Foundation collaborates with the University of Wisconsin Population Health Institute to bring this program to communities across the nation.
Rankings
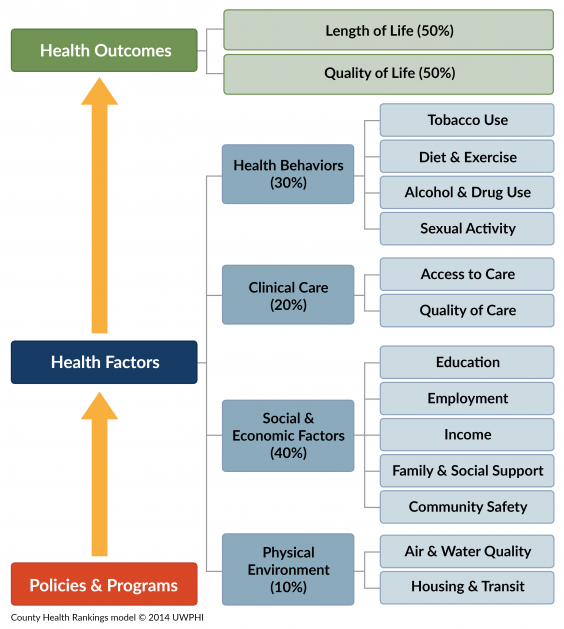
The Rankings are based on a model of population health (see right) that illustrates the many factors that influence health and are measured in the Rankings. We report these ranks at countyhealthrankings.org, along with all the underlying measures and additional data for this year and prior years.
We compile the Rankings using county-level measures from a variety of national data sources. These measures are standardized and combined using scientific weights. We then rank counties within each state, providing two overall ranks that address two key questions:
Health Outcomes: How healthy are community members in a county now?
Health Factors: What are the opportunities for community members to be healthy in the future?
The ranks call attention to the wide gaps among counties within states in what matters for health. These gaps represent disparities in health outcomes and inequities in opportunities to live long and well.
What Works for Health
When it comes to developing and implementing solutions to problems that affect communities, evidence matters. What Works for Health is an easy-to-use, online tool that summarizes evidence for policies, programs, and systems changes that can make a difference locally.
Action Center & Community Guidance
We offer many pathways for self-directed and peer learning, web-based content, and virtual interactive forums that are designed to accelerate learning and action to build healthier communities and advance equitable opportunities. Our online Action Center, featuring Action Learning Guides and a Partner Center, offers steps for communities to move forward by working together to engage diverse partner organizations and community members, assess needs and resources, and act on what’s important to create positive change that has a lasting impact.
A Decade of Data: Rankings 2010 to 2020
County Health Rankings Measures for Length of Life:
Life Expectancy is a measure of the average number of years a person can expect to live from birth. Learn more about life expectancy at countyhealthrankings.org/life-expectancy.
Premature death is measured in Years of Potential Life Lost (YPLL) before age 75 in the Rankings. More years of life are lost when deaths occur among younger age groups. Learn more about YPLL at countyhealthrankings.org/ypll.
Since 2010, the County Health Rankings have measured the health of communities by examining how long and how well people live. A decade later, trends in length of life – a key measure of the health of a community – show us that health outcomes have improved for some groups of people in some places and worsened in others.
Progress in Health Outcomes: Length of Life
Key Findings
- After a drop in life expectancy in recent years, there are signs that the overall negative trend in life expectancy may be leveling off (see dashed blue line).
- Nationwide, not all groups of people have experienced the same trends in health outcomes. The gap in life expectancy across racial and ethnic groups in our country continues to be about 12 years.
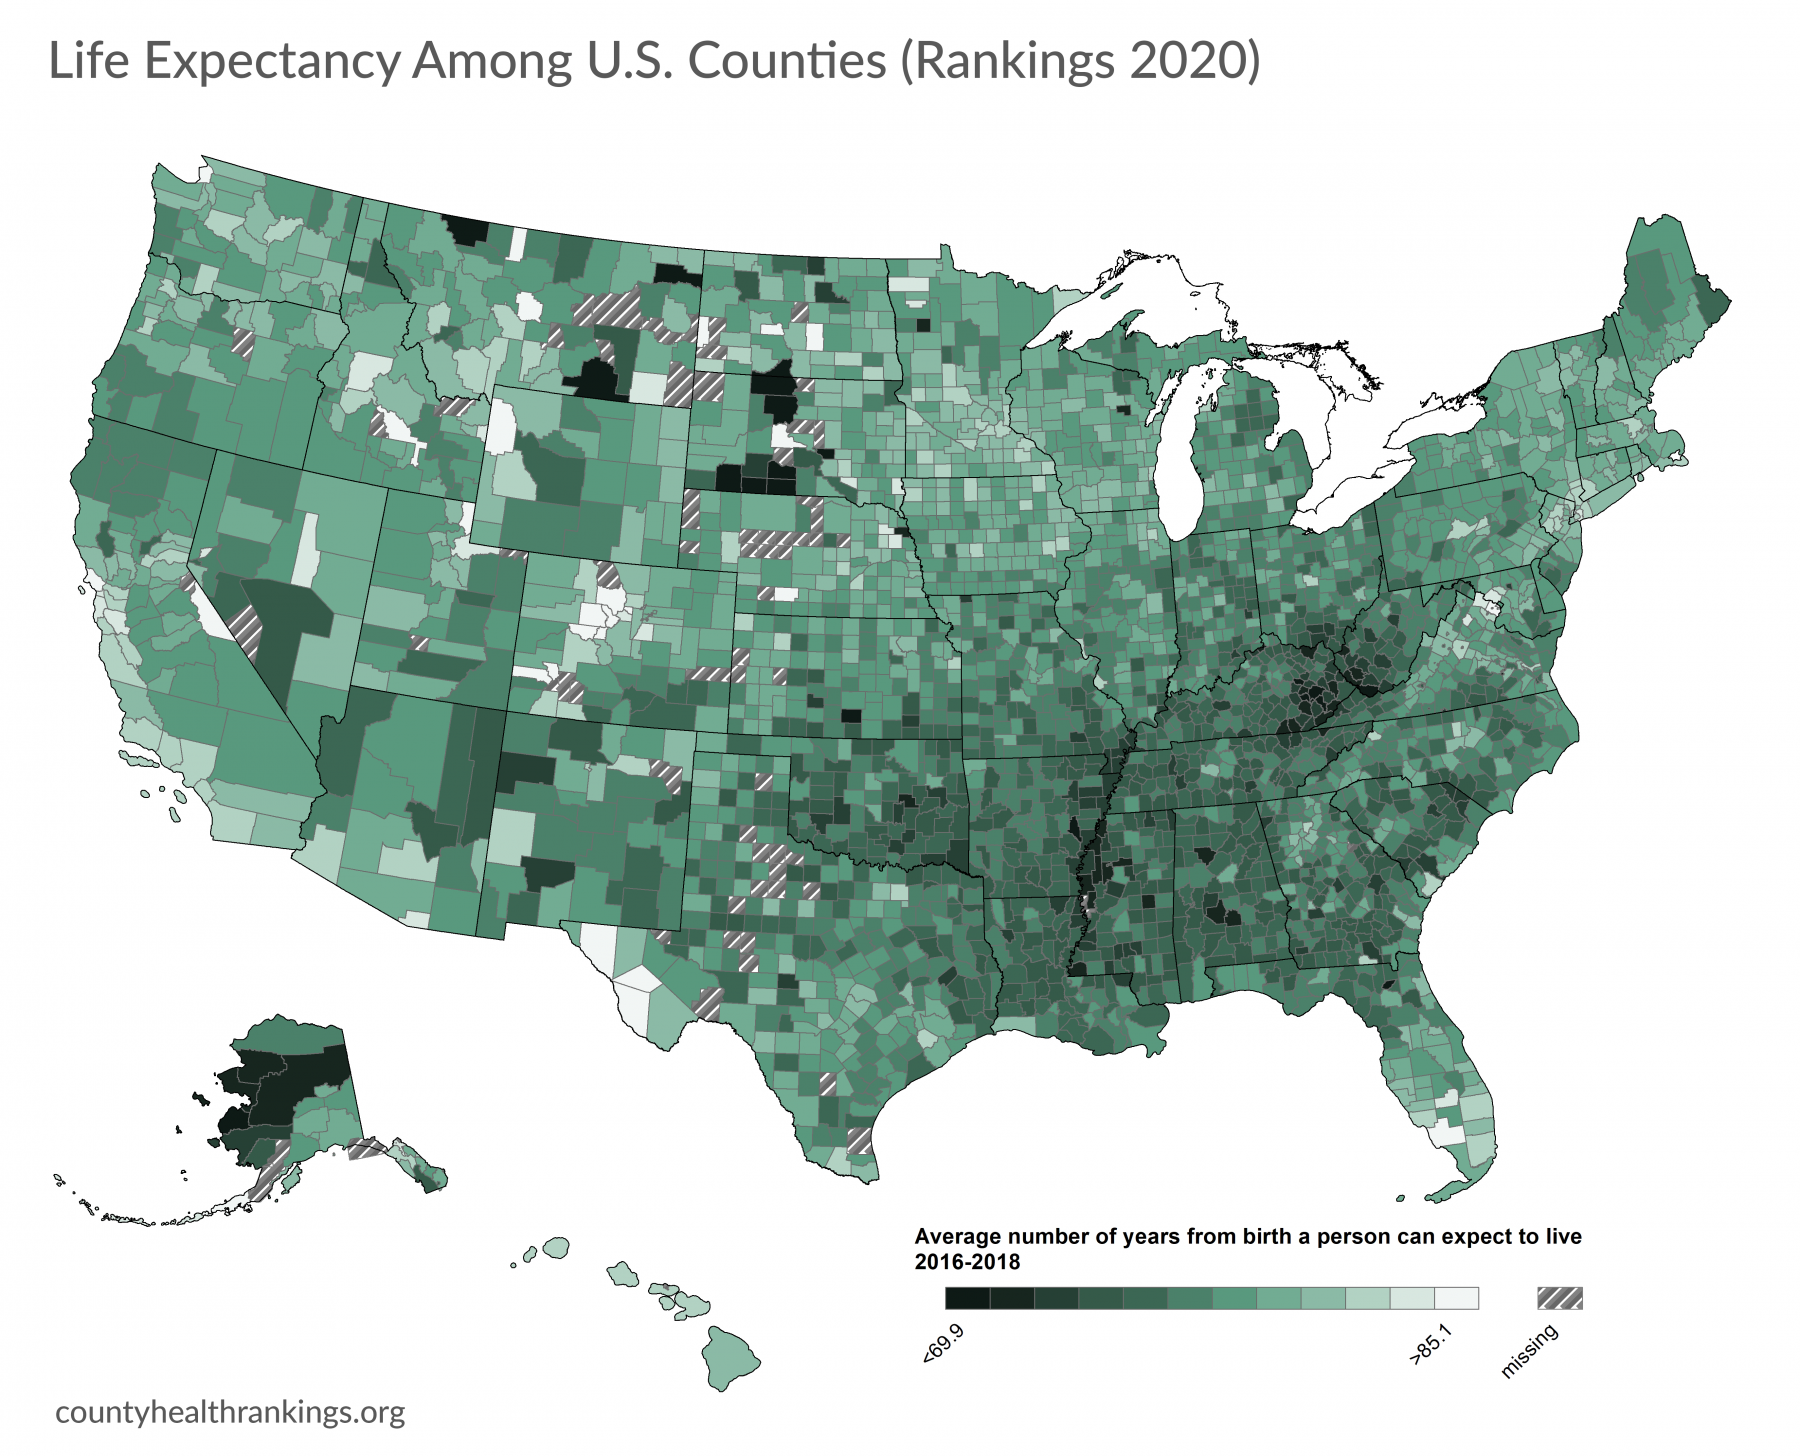
- Life expectancy from birth varies across U.S. counties by over 40 years, with a low of 61.6 years on average. Recent data show that counties on the West and Northeast coasts have higher average life expectancy, while residents of the Deep South, Appalachia, and Tribal Lands live shorter lives.
- From the 2010 to 2020 Rankings, most counties have seen progress or held steady in measures of length of life. However, there are disparities by community type. More metropolitan counties improved than worsened (n=127 vs. n=98, respectively) in premature death, while, among rural counties, more worsened than improved (n=190 vs. n=90, respectively).* Life expectancy from birth in rural counties is 78.2 years, while those born in metropolitan counties can expect to live at least one year longer on average.
*See Technical Note #1 and Technical Note #2.

EXPLORE LOCAL:
You can learn more about life expectancy among racial and ethnic groups and the leading causes of death in your county snapshot. Visit www.countyhealthrankings.org.
Progress in Health Factors: Key Improvements
Over the course of a decade, the Rankings have helped to deepen our understanding of the conditions that shape our opportunities to live long and well. In the Rankings, we examine four factors that influence the health of counties: health behaviors, clinical care, social and economic factors, and the physical environment. In turn, each of these factors is based on several measures – the full list of factors and measures is provided here. Social and economic factors impact health more than any other group of factors.
While there is work to be done to create communities where everyone can be their healthiest, the 2020 Rankings show us there are signs of progress in key factors. We highlight the direction health factors in U.S. counties have shifted from the 2010 to 2020 Rankings using the most recently available data for key measures of health behaviors, clinical care, social and economic factors, and the physical environment.
- From the 2010 to 2020 Rankings, there were signs of progress in social and economic factors, including more educational attainment and lower unemployment rates.
- Though data for the most recent years are not available, there were also signs of progress in uninsured rates for U.S. counties overall.
- Counties have also seen improvements in health behaviors, such as lower rates of adult smoking and teen births.
Worsening in Health Factors: Key Challenges that Remain
- Rates of children living in poverty have shown little indication of meaningful progress in the past decade and income inequality is rising.
- Rates of homeownership have changed little over a decade. There were also signs that more adults have long commutes, spending more time to get to work.
- Rates of adult obesity and sexually transmitted infections showed signs of worsening.
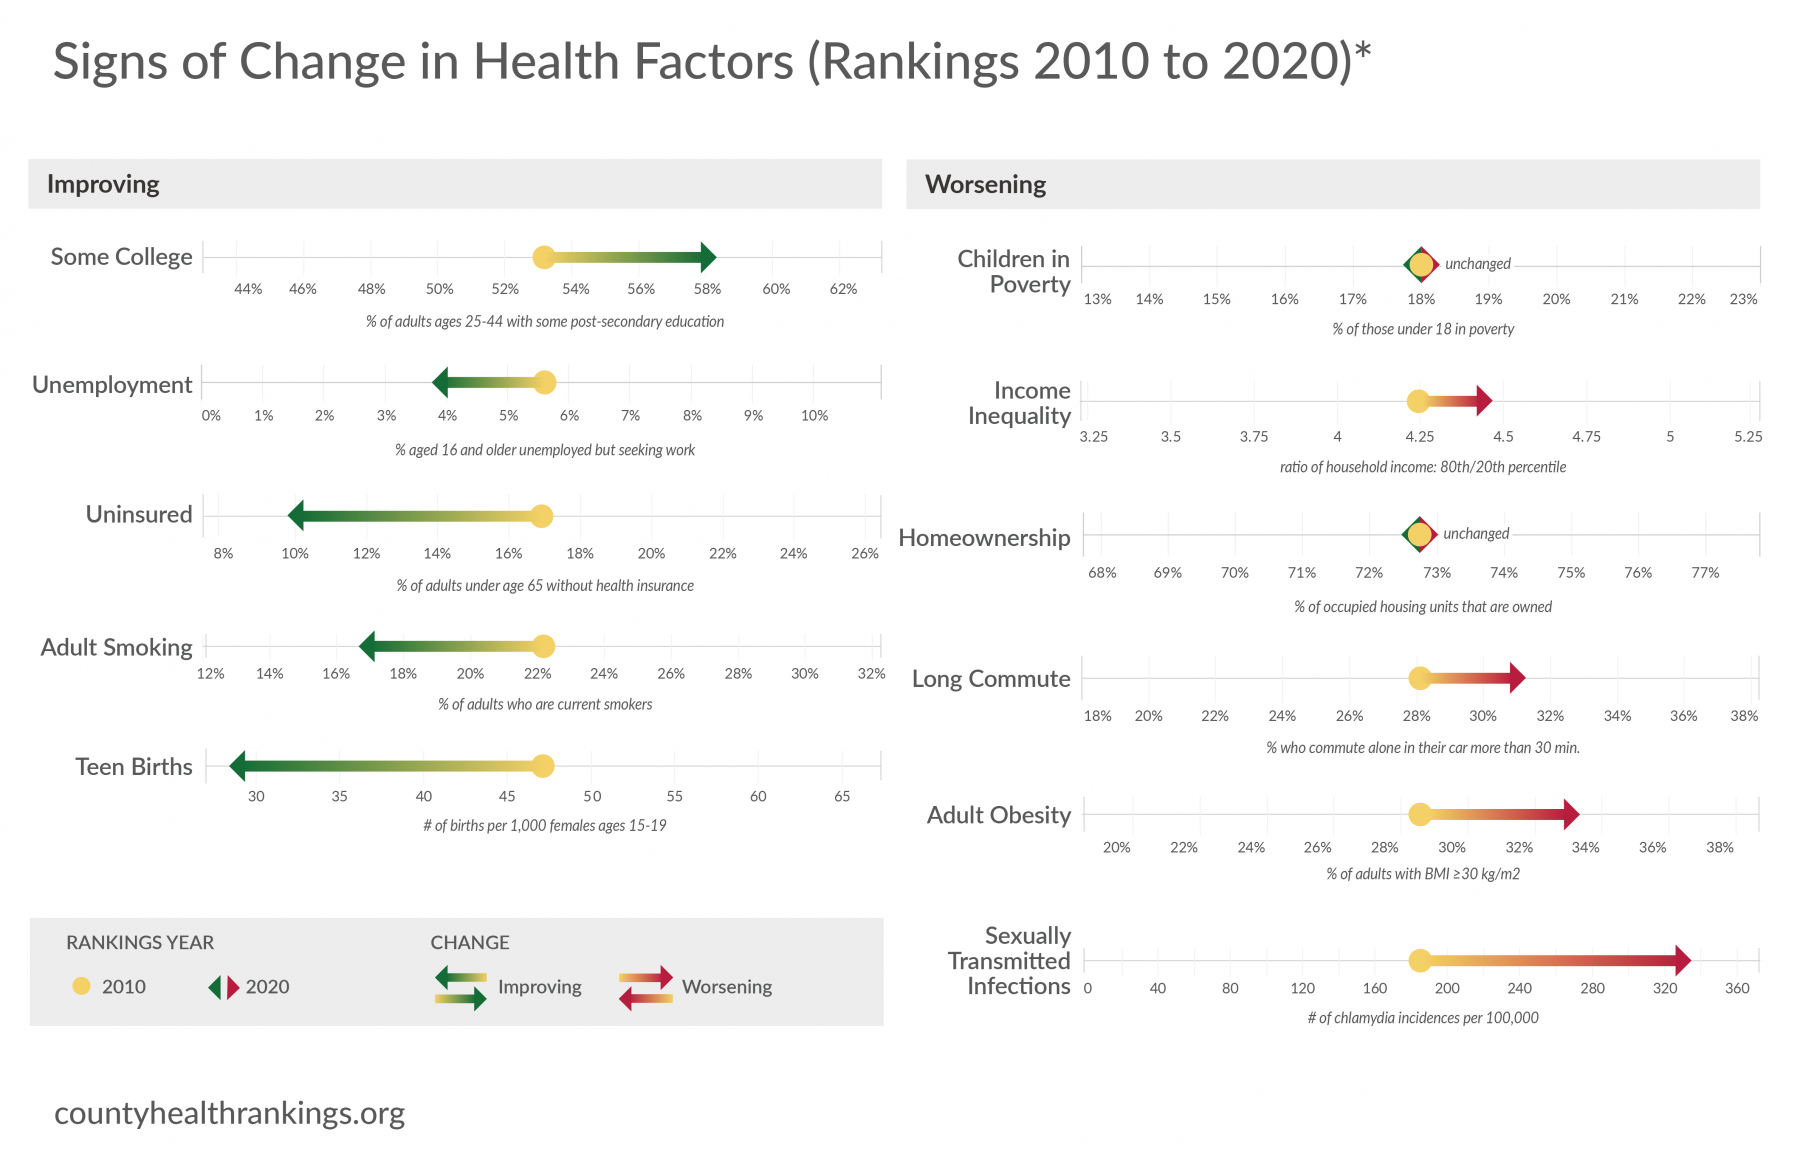
*See Technical Note #3.
EXPLORE LOCAL:
You can learn more about local trends in health factors, areas of strength, and areas to explore in your county snapshot. Visit www.countyhealthrankings.org.
The Journey to Thrive for Counties Among the Least Healthy
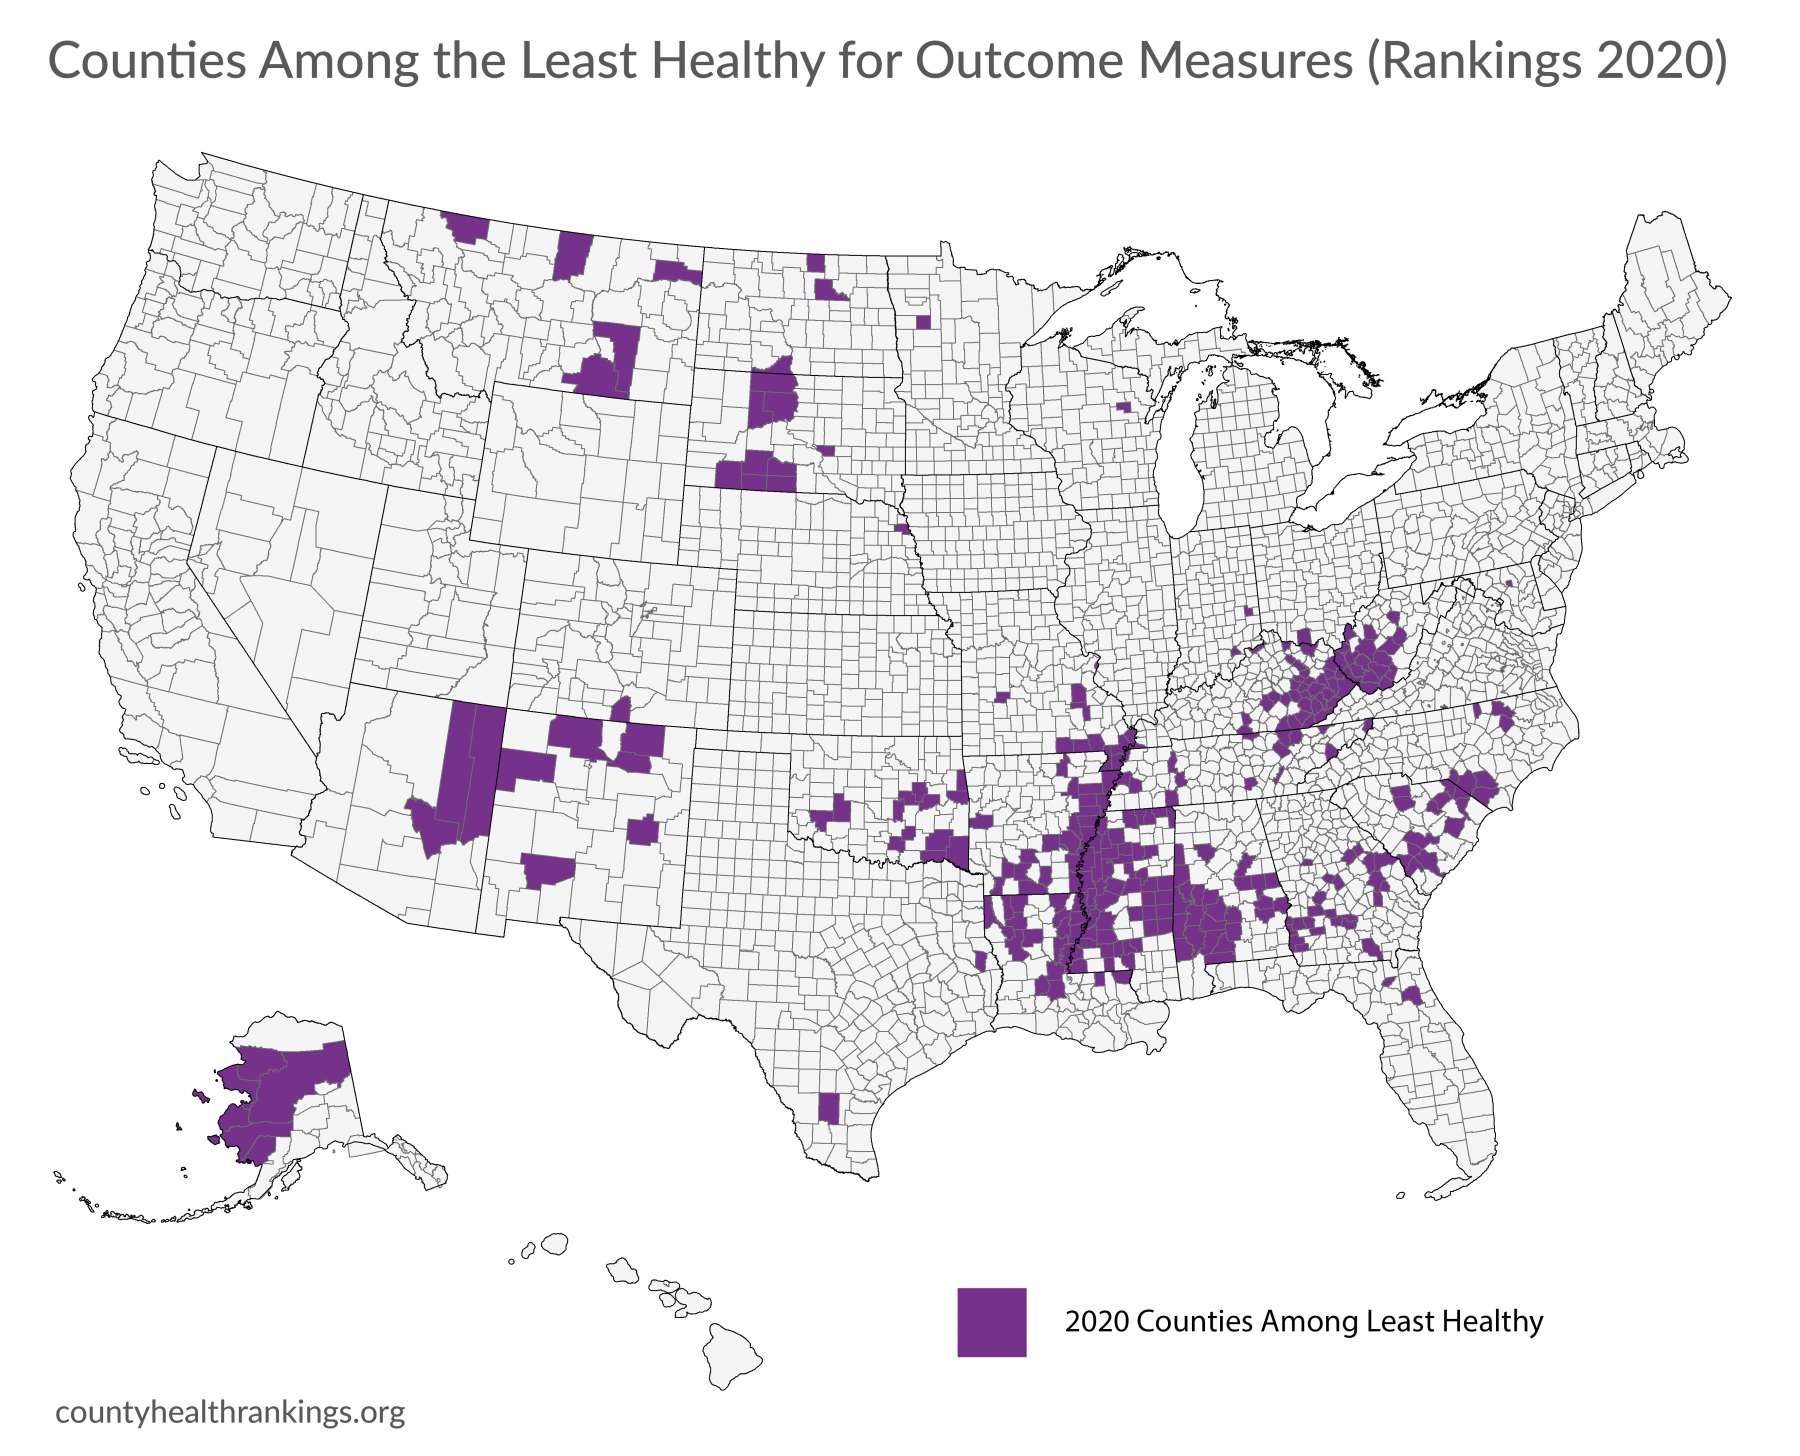
The County Health Rankings have shown that stark disparities persist in the opportunity to live long and well across U.S. counties. Not all groups of people, everywhere, have experienced the same progress in health factors and outcomes. Here we describe the challenges and signs of positive change for the counties among the least healthy* – scoring in the lowest decile for health outcomes measures.
*See Technical Note #1 and Technical Note #4.
Key Findings
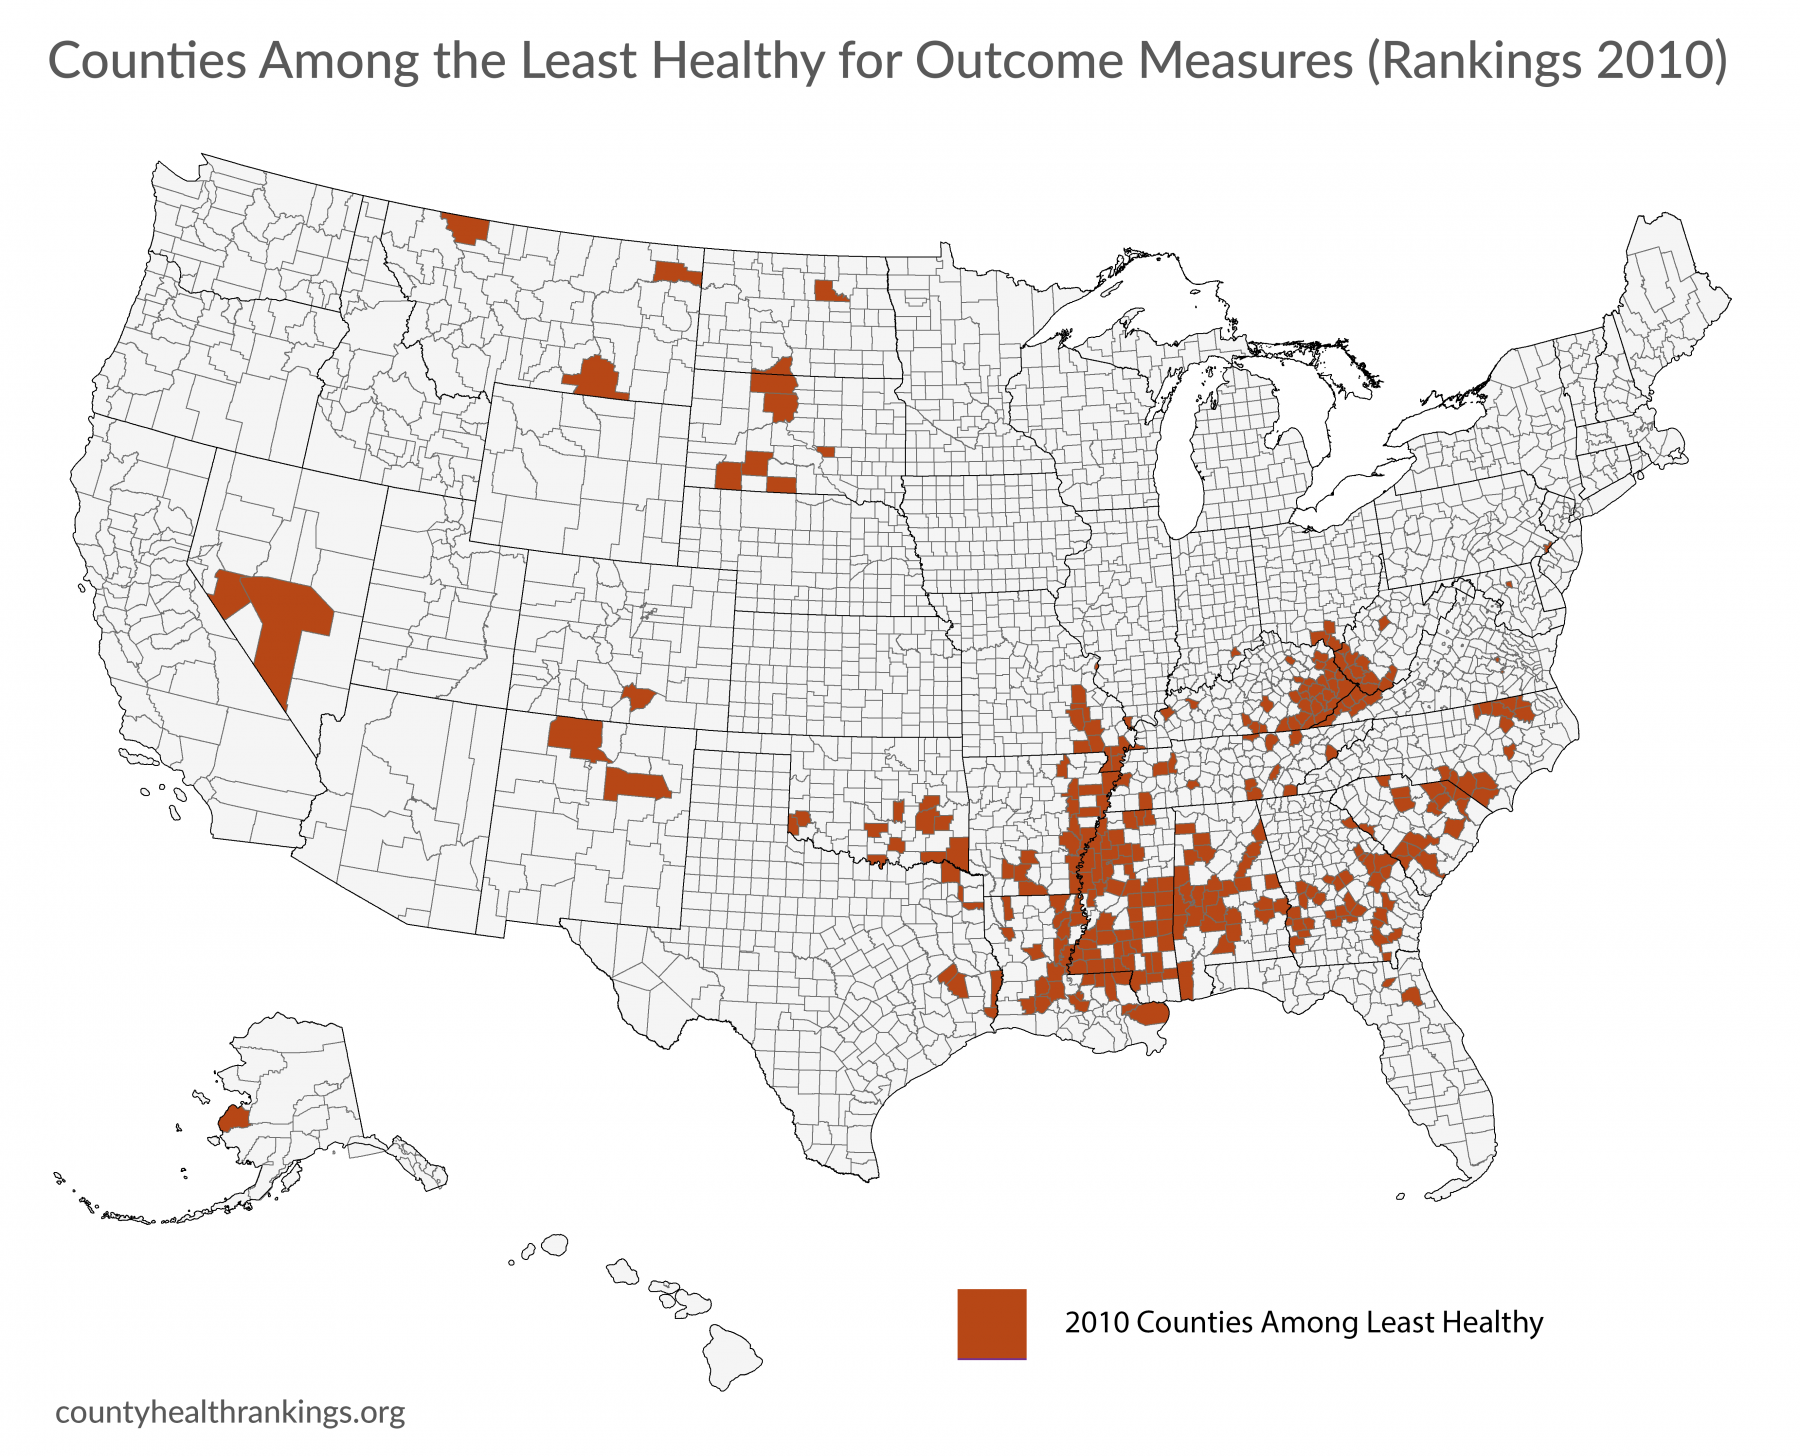
- Counties that are among the least healthy in the 2020 Rankings* are a part of the Deep South, Appalachia, and Tribal Lands.
- Nearly a decade ago, the pattern was largely the same, as the majority of counties among the least healthy in 2020 were among the least healthy in the 2010 Rankings.
- These counties represent all community types, though they are largely rural. They generally have smaller populations and have seen slow population decline over the course of a decade.
- In addition to experiencing poor health outcomes, these counties also face barriers to opportunity. Counties among the least healthy in the 2020 Rankings had higher rates of poverty, uninsured, and unemployment than the rest of the nation’s counties.
*See Technical Note #4.
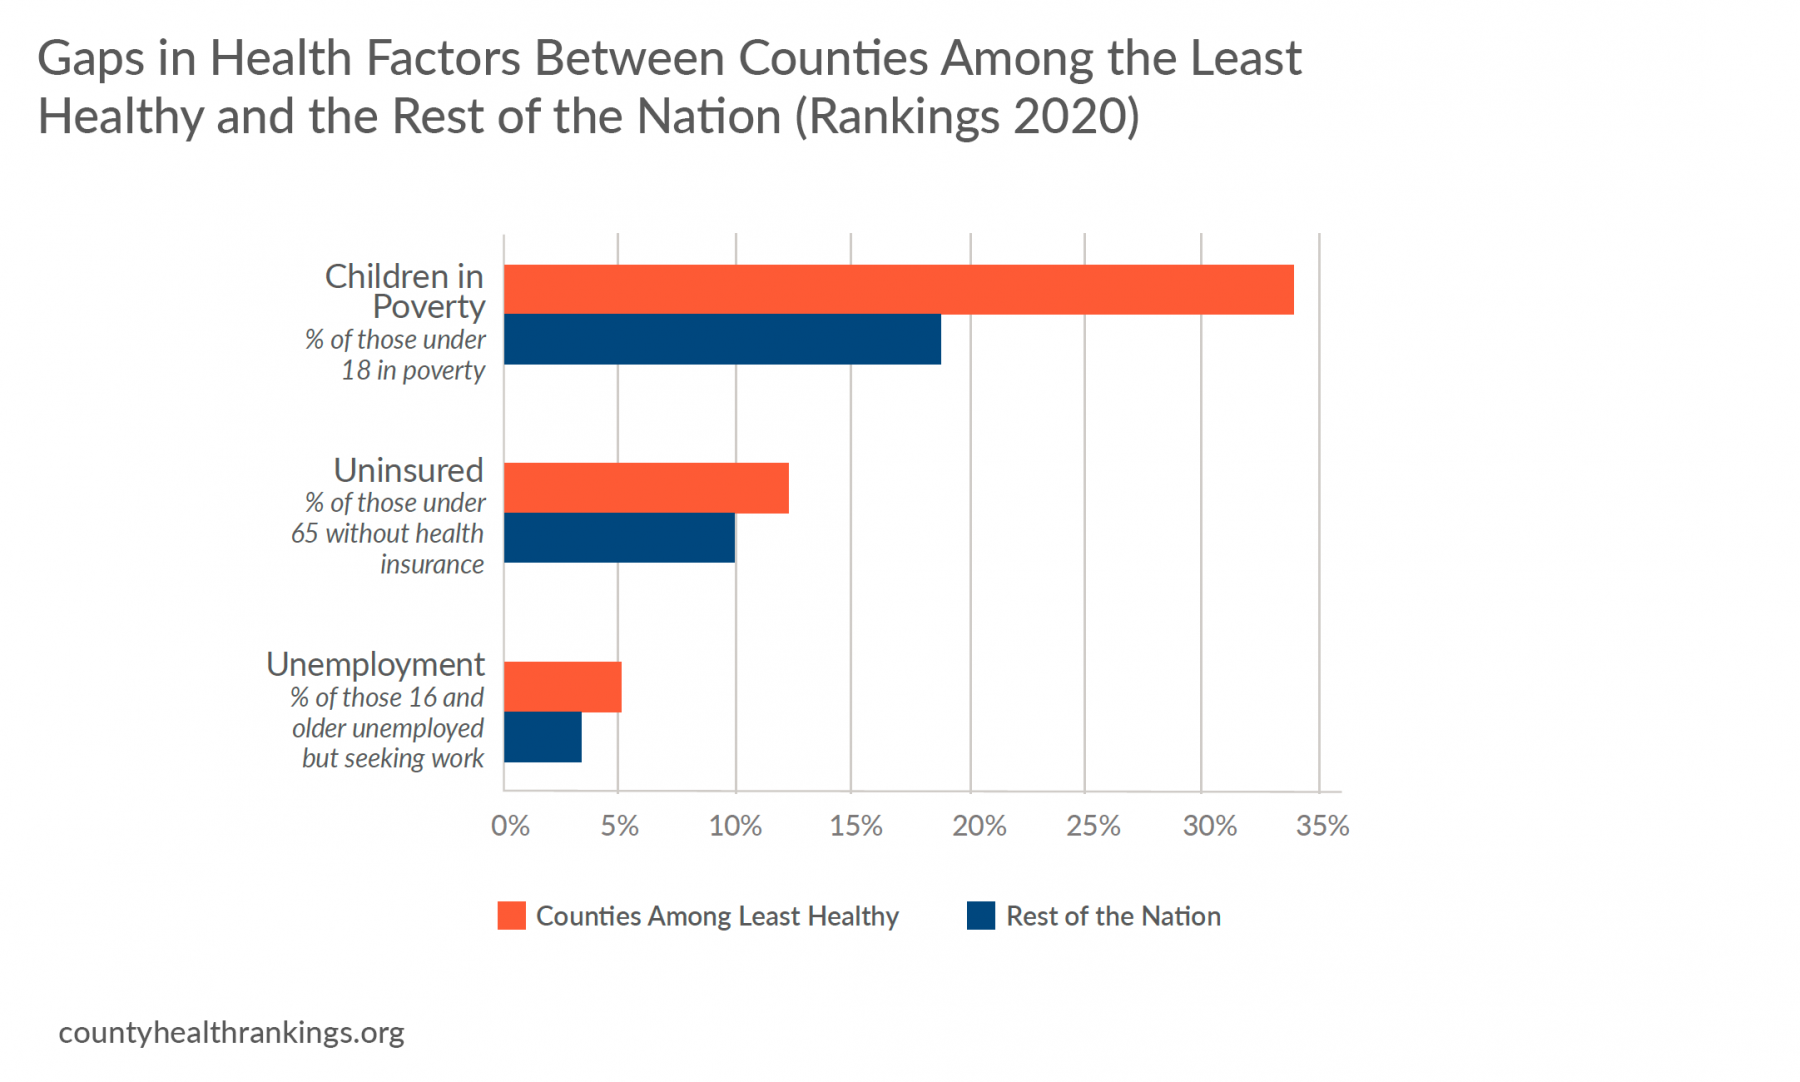
Too often, these places are only recognized because they are where people experience the worst health outcomes. Yet, many of these places have achieved progress despite challenges, for example, by building from their strengths and engaging residents in decision making to improve their communities so that everyone can thrive. Following the Great Recession, more than half of counties among the least healthy in the 2010 Rankings improved in rates of unemployment and uninsured.
Many communities have found a way forward through obstacles to opportunities. Past and present discriminatory policies and practices – such as racial segregation through redlining, legal actions to terminate tribal culture and land rights, and disinvestment in rural economies – have contributed to many communities consistently landing among the least healthy in measures of health and opportunity.
However, there is work that remains. Where counties among the least healthy in the 2010 Rankings made progress, so did the rest of the nation. Other counties nationwide started ahead and outpaced counties among the least healthy, particularly for rates of children living in poverty.
Addressing the Past to Create Future Opportunity

Richmond, Virginia – where nearly 60% of the 227,000 residents are people of color – is a city that recognizes that to change its future and improve health for all, it must understand its past. For many that call this former capital of the Confederacy home, decades of discriminatory policies and practices have left a heavy, lasting footprint, but now Richmond is striving to create a city of inclusion and opportunity. Historically ranked among the least healthy counties in Virginia, Richmond employs a comprehensive approach to addressing social and economic barriers, such as poverty, through the city’s Office of Community Wealth Building (OCWB). OCWB’s strategy includes systems transformation and a focus on direct services. Its workforce initiatives, which assisted over 870 people in 2019 connect residents to jobs through training, mentorship, wrap around services, and apprenticeships in efforts to address the racial gap in income – median household income is nearly $33K for Black households, $35K for Hispanic households, and $58K for White households. The city’s Building Lives to Self-Sufficiency program offers targeted support to heads of households to help them identify barriers to their success and connect them to the resources needed to overcome them.
Honoring Values and Traditional Knowledge for Stronger Families and Healthier Communities

Sitka, Alaska – a community with a population under 10,000 – realized that achieving better health for all meant honoring the social, cultural, and political fabric of this place. A vital shift in the city among local leaders, city and state agencies, and organizations working with the indigenous Tlingit people and the Sitka Tribe of Alaska (STA) is helping Sitka emerge from a painful history. Russian colonization and decades of U.S. government policies separated Native families, suppressed their culture and language, and brought about disparities in education, employment, and health. Strengthening families for the health of children has been at the core of the partnership between the Alaska Office of Children’s Services and STA in their work to better enforce the federal Indian Child Welfare Act of 1978. It affirms tribes’ jurisdiction over custody cases involving Native children and aims to keep children from being severed from their culture and identity. The state and tribal social services and courts personnel have trained and planned together, including helping non-Native state staff better understand the history and impact of trauma on tribal citizens. The collaboration has created a more culturally sensitive process for keeping Native families intact and has fundamentally shifted outcomes. Sitka now has Alaska’s lowest per capita rate of Native children removed from their homes in child welfare cases.
Investing in Education, Housing, and Jobs for Better Health
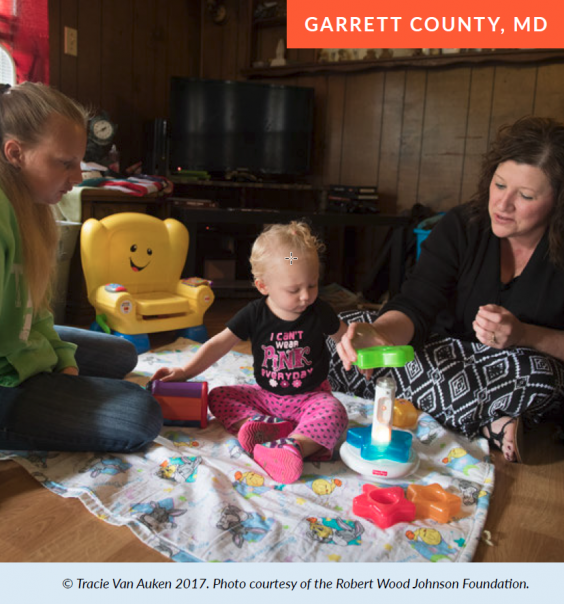
Garrett County, Maryland – a rural Appalachian community of nearly 30,000 bordering Pennsylvania and West Virginia – is tackling poverty head-on with investments in education, housing, and jobs. A vast county where many residents work seasonal and lower-wage jobs, the county faces a rate of 18% of children living in poverty, compared with 12% across the state. Local leaders understand that to help families thrive, their approaches must address both the needs of children and their parents. The county’s 2-Generation approach is helping families build their own roadmap to economic stability with “pathway plans” that include goals in education, employment, and financial management. This approach helps families achieve their goals by providing supports like child and elder care and job training. The county’s scholarship program is boosting educational attainment by allowing residents with a high school degree or GED to attend Garrett College tuition-free, changing the trajectory of more than 2,000 students’ lives since its 2006 inception. Along with public and private partners, Garrett’s Community Action Committee is expanding housing options by developing more than 700 affordable, low-income, mixed-income, and workforce housing units.
Every County has Room for Improvement
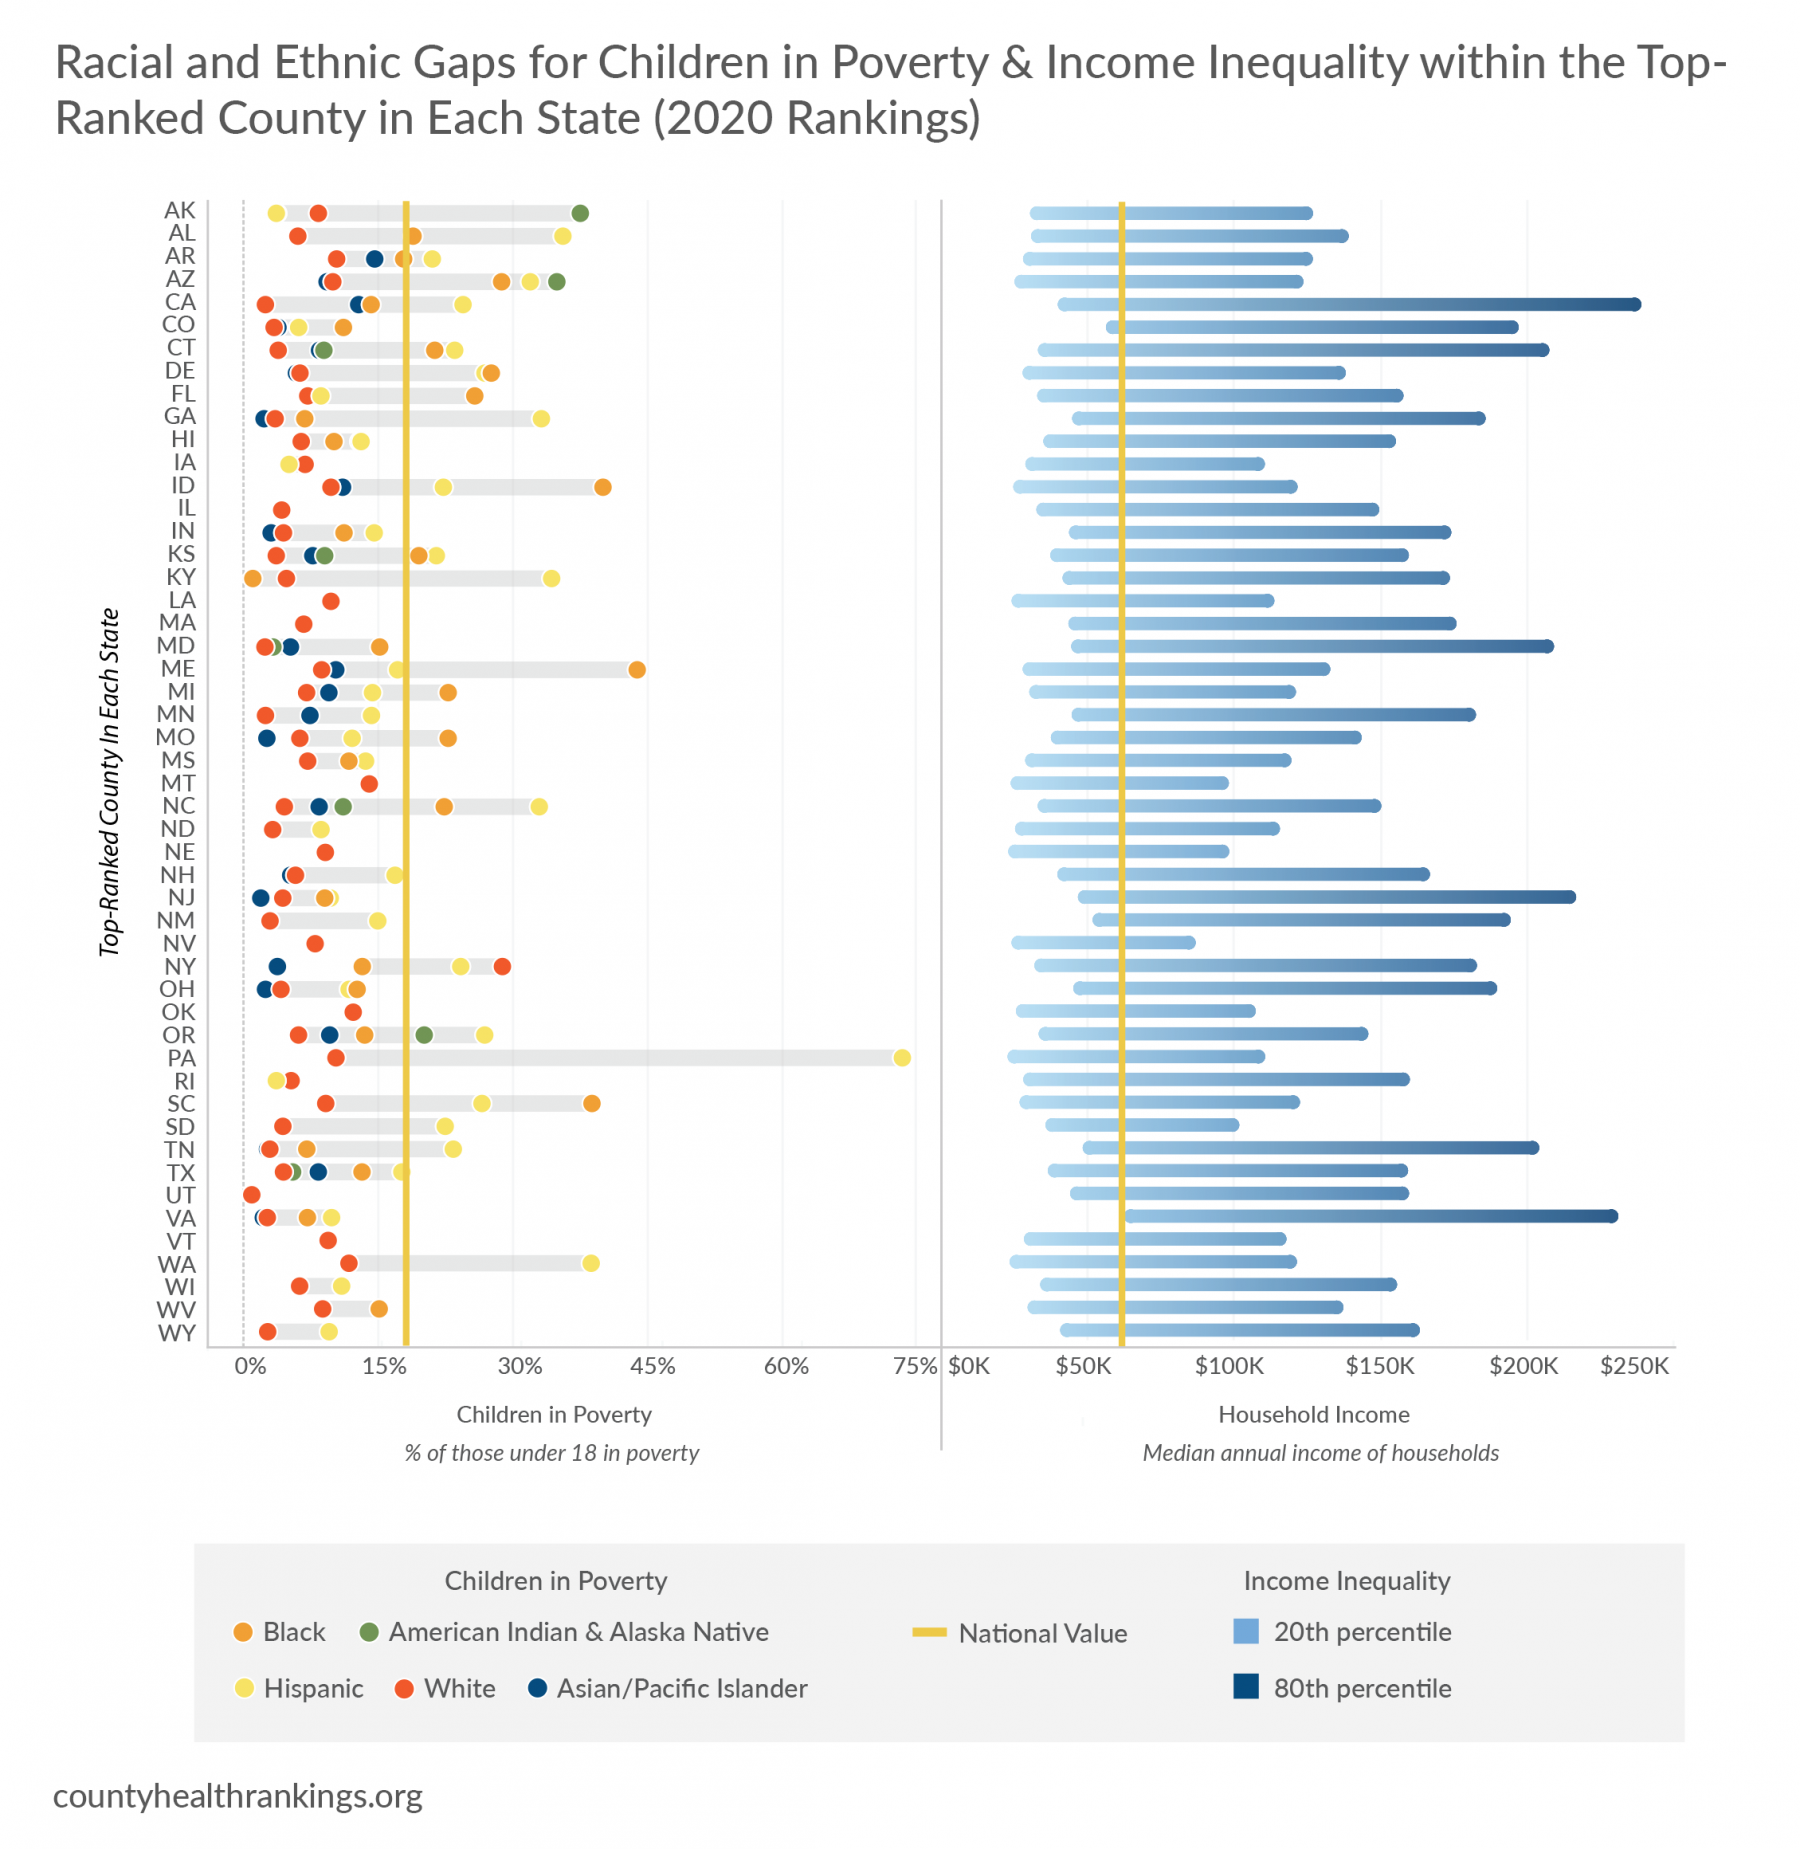
Ranking counties on health factors and outcomes calls attention to the fact that place matters, and, from one county to the next, there are meaningful differences in the opportunity to be healthy. Data show not only large differences across counties, but also striking differences within counties. Even within the top-ranked county of each state,* there are gaps in opportunities that keep people from being their healthiest. These gaps exist in some form across all U.S. communities and point towards deeply rooted and unfairly structured barriers to economic opportunity, such as residential segregation, discriminatory practices in housing and bank lending, or tax policies that exacerbate the wealth divide.
*See Technical Note #5.
Key Findings
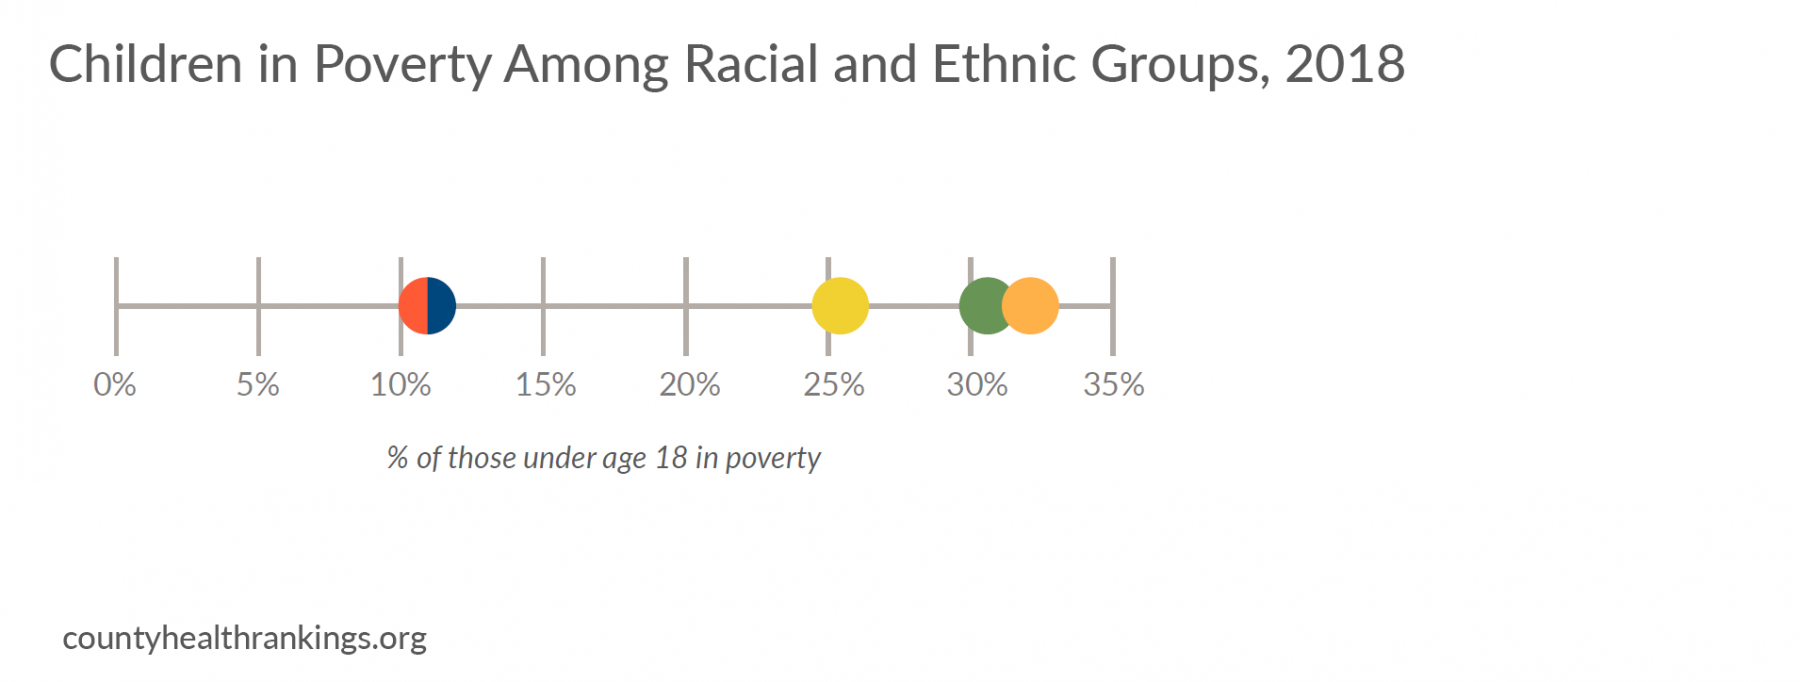
- All counties among the topranked have room to improve. Within these counties, rates of children living in poverty disproportionately burden children of color. And, wide income gaps exist between the 80th and 20th percentiles of earners, a measure of income inequality.
- Within the top-ranked county of nearly half of all states, the poverty rates for American Indian and Alaska Native, Black, or Hispanic children are higher than the national value of 18%.
- Even in a wealthier county among the top-ranked, there are varying levels of income with certain groups living in poverty. Within the top-ranked county of 30 states, households in the lowest quintile of income make $100K less than households in the highest quintile.
EXPLORE LOCAL:
Visit countyhealthrankings.org to interact with these data for all counties and for more data on social and economic factors, and differences by place, race, and ethnicity within your county.
A Closer Look: Income, Poverty, and Unemployment
Household income and jobs that pay a living wage shape our opportunities and choices about housing, education, child care, food, medical care, and more. Opportunities for better health erode for households with lower income or in poverty who often face less access to good jobs with livable wages, affordable housing, and grocery stores with healthy foods. Due to various manifestations of structural racism, including redlining and discriminatory hiring practices, families of color are disproportionately represented among households of lower income and in neighborhoods segregated from economic opportunities, quality goods, and services. Systematic disinvestment in rural economies, including reduction of manufacturing sector jobs, has also affected social and economic conditions across regions of our country. Children are particularly vulnerable to the adverse effects of a lack of family income that allows enough money to cover basic needs and save for setbacks. Nearly 13 million – 1 in 6 – children in the U.S. live in poverty, a marker of both current and future health.
Key Findings
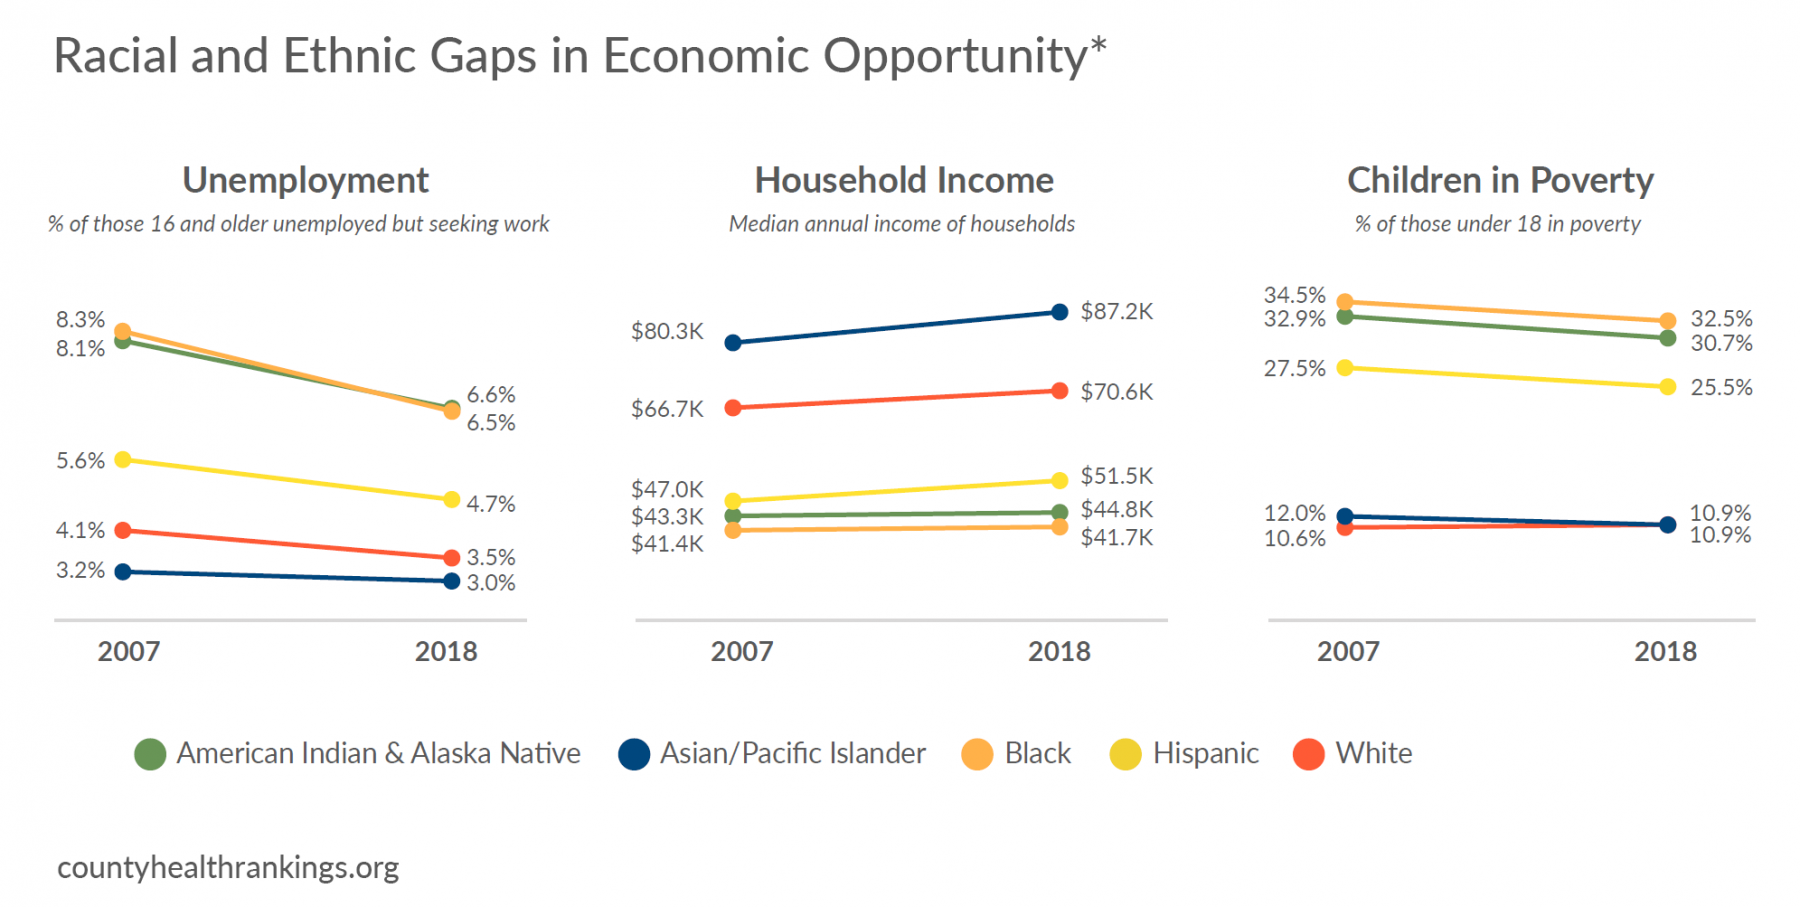
- Though unemployment declined for households of all racial and ethnic groups over the past decade, American Indian and Alaska Native, Black, or Hispanic people continue to have higher unemployment rates. These households largely saw modest gains in household income* compared to White or Asian households.
- Annual income for White or Asian households continues to be almost $20K higher than for American Indian and Alaska Native, Black, or Hispanic households.
- National trends show 18% of children lived in poverty in 2018, levels comparable to a decade ago. A closer examination of post-Recession trends from 2014 to 2018 show that these rates have remained static in the majority of counties nationwide (57%), while 41% of counties improved.*
- Recent data show the highest rates of children in poverty are in counties in the Southwest and Southeast regions, as well as parts of Appalachia, the Mississippi Delta, and Tribal Lands.
- Racial inequities persist, as poverty rates are higher for American Indian and Alaska Native, Black, or Hispanic children*; often twice as high as rates for White children. Where data are available, this pattern holds true across a majority of U.S. counties.
*See Technical Note #2 and Technical Note #6.

*See Technical Note #2 and Technical Note #6.
Making Ends Meet for Households with Lower Income
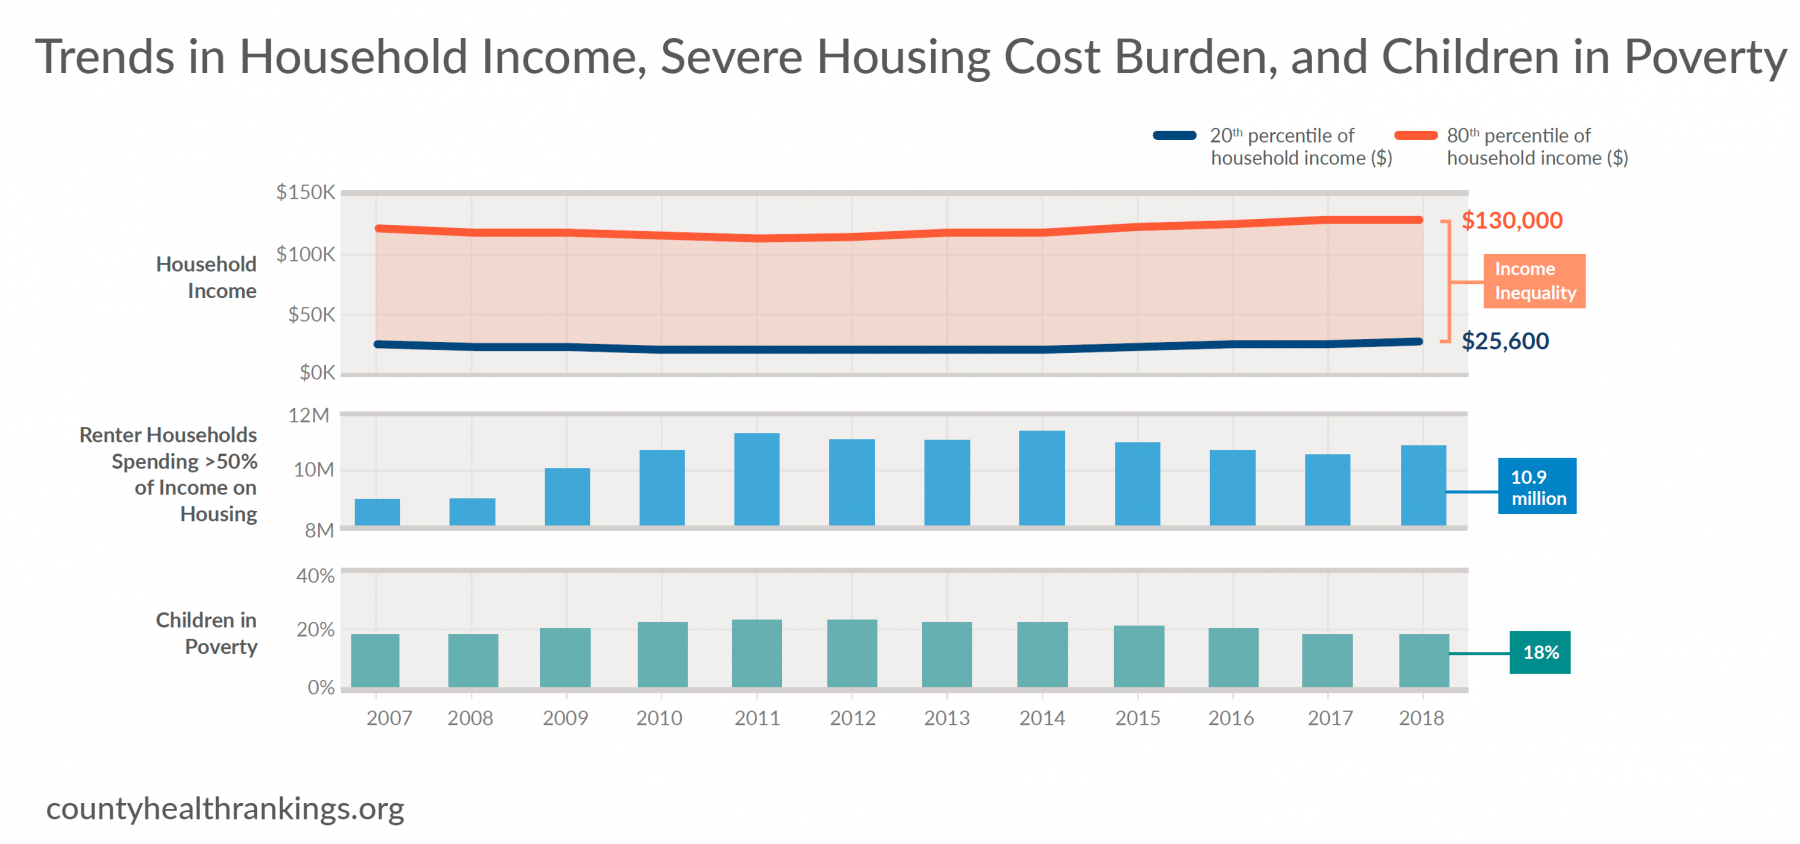
- Much like the stalled progress for rates of children living in poverty, over the past decade, there has been little change in income for households* in the lower income tiers (20th percentile of incomes). Meanwhile, incomes at the top (80th percentile) continued to grow.
- Household income, particularly for those in the lower tiers, has not kept pace with the cost of basic needs, such as housing – the single largest expense for most families. In 2018, 16.7 million households were severely housing cost burdened, paying 50% or more of their income for housing. Renters make up the majority of these cost burdened households.
- Over the decade, severely cost burdened renter households grew by almost two million to nearly 10.9 million in 2018. Renter households with incomes under $15K, the approximate annual income for minimum wage earners, continue to face the highest burden rates with nearly three out of four spending half or more of their income on rent.
- In 2018, nearly seven million children in poverty lived in a household that spent half or more of their income on housing, leaving little else for other basic needs like food, transportation, or child care.
*See Technical Note #6
Creating Community Conditions For Everyone’s Health
San Antonio, Texas – Home to 1.5 million people, San Antonio, Texas is the seventh largest U.S. city by population, 60% of whom are Hispanic. San Antonio offers reminders of its past, like the Mission San Juan Capistrano from 1731, and glimpses of its future, seen in the new shops and residences in the upscale Pearl District. Community partners are taking a hard look at entrenched problems to provide all with greater opportunity. The city’s Office of Equity is leading with equity in all policies to reduce health disparities and the city’s budget prioritizes the needs of residents in historically excluded neighborhoods as demonstrated by the parks and trail development in several low-income communities. UP Partnership aligns the efforts of 16 local school districts countywide to improve educational outcomes in everything from early grade reading to high school completion. Some of the greatest gains have been in reducing the uninsured rate for children and youth. Most recent data show that Bexar County has a rate of uninsured children of 8.2%, compared to the state’s uninsured rate of 11.2% and Texas is the only state with a double digit uninsured rate for children in the country. San Antonio’s Food Bank, which distributed 63 million pounds of food in 2016, goes beyond food distribution by seeking to address the root causes of food insecurity through free job training.
Dismantling Structural Barriers for a Brighter Economic Future

Broward County, Florida – In the demographically diverse community of Broward County, Florida, with a population of 1.9 million – where nearly 60% of the population are people of color – local government is leading the charge in addressing unfair and reinforcing structures that have led to disparities. The county-led Dismantling Racism Initiative is creating space for difficult conversations through interracial dialogue and bias trainings for nearly 3,500 people within government agencies, schools, public health, and social service providers. The school system – sixth largest in the nation – is bridging the racial achievement gap with equity liaisons in every school, and efforts to increase participation from students of color in activities like computer coding and debate are helping students succeed. Broward’s intentional education focus is yielding results – graduation rates for Black students have climbed from 66% in 2013 to 81.6% in 2019, while in the same year graduation rates for Hispanic students was 86.9% and White students 91.6%. Broward is among the most expensive places to live in the country – more than half of nearly 681,500 households have work, but due to the high cost of living, struggle to afford basic needs like housing, food, child care, and transportation. To address these challenges, government, business, and nonprofit leaders work together through the Coordinating Council of Broward to pursue policy changes in partnership with residents. Together, they rallied voter support of new taxes to fund the construction of more affordable housing and transportation improvements.
For information on these approaches and other specific strategies that can make a difference, visit What Works for Health.
Taking Action to Improve Social and Economic Opportunity and Reduce Child Poverty
No child should have to grow up in poverty. Our nation’s youth should have the chance for a healthy start to life, regardless of where they live, how they look, or their family circumstances. Taking action to help children and their families today and prepare our future leaders will require a commitment to dismantling racism and all forms of discrimination backed by political will and equitable investments in strategies that can make a difference, including:
Invest in education from early childhood through adulthood – such as publicly-funded prekindergarten or career and technical education – to create environments that support learning and boost employment and career prospects.
Increase or supplement income and support asset development in low-income households such as through expanded earned income tax credits, jobs that pay a living wage, or subsidized asset accumulation programs.
Support inclusive community development, reduce displacement, and ensure access to secure and affordable housing, for example, through zoning, tax credits and other government affordable housing subsidies, housing choice vouchers for low-income households, and fair housing laws and enforcement.
Ensure that everyone has adequate, affordable health care coverage and receives culturally competent services and care by increasing accessibility such as through community health workers and school-based health centers, and training health care professionals on cultural diversity.
Foster social connections within communities, adopt trauma-informed approaches to community building and support, and cultivate empowered and civically engaged youth and adults through leadership development and peer mentoring.
Technical Notes and Glossary of Terms
What is health equity? What are health disparities? And how do they relate?
Health equity means that everyone has a fair and just opportunity to be as healthy as possible. This requires removing obstacles to health such as poverty and discrimination, and their consequences, including powerlessness and lack of access to good jobs with fair pay, quality education and housing, safe environments, and health care.
Health disparities are differences in health or in the key determinants of health, such as education, safe housing, and discrimination, which adversely affect marginalized or excluded groups.
Health equity and health disparities are closely related to each other. Health equity is the ethical and human rights principle or value that motivates us to eliminate health disparities. Reducing and ultimately eliminating disparities in health and its determinants of health is how we measure progress toward health equity.
Structural or institutional racism is race-based unfair treatment built into policies, laws, and practices. It often is rooted in intentional discrimination that occurred historically, but it can exert its effects even when no individual currently intends to discriminate.
Braveman P, Arkin E, Orleans T, Proctor D, and Plough A. What is Health Equity? And What Difference Does a Definition Make? Robert Wood Johnson Foundation. May 2017.
Note: In this report, we use the terms disparities, differences, and gaps interchangeably.
Technical Notes:
- Metropolitan and rural counties were categorized according to the 2013 NCHS Urban-Rural Classification Scheme for Counties. We define metropolitan counties (n=1166) as those belonging to metropolitan statistical areas with a population greater than 50,000. The remaining non-metropolitan counties are considered rural (n=1976).
- The percentages of counties that improved, remained static, or worsened on measures were determined by examining the statistical significance of the linear trend across the time period.
- Values in the figure are the median value of counties for each measure at the time of the 2010 and 2020 Rankings except for Uninsured and Children in Poverty, which are the national values at both time points. There are different data year spans and differential missingness between 2010 and 2020 data. The magnitude of change from 2010 to 2020 was determined by the calculation of paired samples t-tests and Cohen’s D using county-level data.
- Counties among the least healthy in 2010 and 2020 scored among the 10th percentile of counties nationwide for health outcomes z-score in at least two of the three Rankings between 2010-12 or 2018-2020, respectively.
- Top-ranked counties are those within states that have had the top Health Outcomes rank, on average, over the three most recent Rankings releases. Extreme and missing values for Children in Poverty can occur in counties with small sub-group populations. Values with 95% confidence intervals widths >40% were suppressed. See analytic files at www.countyhealthrankings.org for unsuppressed values and 95% confidence intervals.
- Values for household income are adjusted for inflation to 2018 dollars. Households are defined as all people living in a housing unit. Members of a household can be related or unrelated.
How did we select evidence-informed approaches?
Evidence-informed approaches included in this report represent those backed by strategies that have demonstrated consistently favorable results in robust studies or reflect recommendations by experts based on early research. To learn more about evidence analysis methods and evidence-informed strategies that can improve health and decrease disparities, visit What Works for Health.
How do we define racial and ethnic groups?
We recognize that “race” or “ethnicity” are social categories, meaning the way society may identify individuals based on their cultural ancestry, not a way of characterizing individuals based on biology or genetics. A strong and growing body of empirical research provides support for the fact that genetic factors are not responsible for racial differences in health factors and very rarely for health outcomes.
We are bound by data collection and categorization of race and ethnicity according to the U.S. Census Bureau definitions, in adherence with the 1997 Office of Management and Budget standards as follows:
- Hispanic includes those who identify themselves as Mexican, Puerto Rican, Cuban, Central or South American, other Hispanic, or Hispanic of unknown origin and can be of any racial background.
- White includes people who identify themselves as White and do not identify as Hispanic.
- Black includes people who identify themselves as Black or African American and do not identify as Hispanic.
- American Indian and Alaska Native includes people who identify themselves as American Indian or Alaska Native and do not identify as Hispanic.
- Asian includes people who identify themselves as Asian or Pacific Islander and do not identify as Hispanic.
Our analyses by race and ethnicity use several different sources that are inconsistent in how data for those who identify as Hispanic are included or excluded from racial groups. Our analyses also do not capture those reporting more than one race, of “some other race”, or who do not report their race. This categorization can mask variation within racial and ethnic groups and can hide historical context that underlies health differences.
Additional Resources
Credits
Recommended citation
University of Wisconsin Population Health Institute. County Health Rankings Key Findings 2020.
Lead Authors
Marjory Givens, PhD, MSPH
Keith Gennuso, PhD
Sheri Johnson, PhD
Lawrence Brown, PhD
This publication would not have been possible without the following contributions:
Research Assistance
Elizabeth Blomberg, PhD
Courtney Blomme, MS, RD
Matt Rodock, MPH
Anne Roubal, PhD
Molly Burdine
Hannah Olson-Williams
Eunice Park, MIS
Amanda Gatewood, PhD
Kiersten Frobom, MPH, MPA
Lael Grigg, MPA
Bomi Kim Hirsch, PhD
Jessica Rubenstein, MPA, MPH
Jessica Solcz, MPH
Bianca Silva-Gordon
Outreach Assistance
Kate Kingery, MPA
Kitty Jerome, MA
Raquel Bournhonesque, MPH
Ericka Burroughs-Girardi, MA, MPH
Carla Freeman, MA, MBA
Lindsay Garber, MPA
Aliana Havrilla, MPIA
Joe Hinton, MA
Molly Murphy, PhD
Justin Rivas, MPH, MIPA
Attica Scott, MS
Kerry Zaleski, MPH
Carrie Carroll, MPA
Angela Acker, MPH
Olivia Little, PhD
Erin Schulten, MPH, MBA
Communications and Website Development
Burness
Forum One
Kim Linsenmayer, MPA
James Lloyd, MS
Bobbi Tannenbaum, MS
Colleen Wick
Robert Wood Johnson Foundation
Rich Besser, MD
Dwayne Proctor, PhD
Donald Schwarz, MD, MBA, MPH
Abbey Cofsky, MPH
David Adler, DrPH, MPA
Nicole Bronzan
Nancy Fishman, MPH
Joe Marx
Kathryn Wehr, MPH
Scientific Advisory Group
Pat Remington, MD, MPH
Renee Branch Canady, PhD, MPA
David Chae, ScD, MA
Jim Chase, MHA
Maggie Super Church, MSc, MCP
Tom Eckstein, MBA
Rebecca Tave Gluskin, PhD
Kurt Greenlund, PhD
Carolyn Miller, MA, MS
Steven Teutsch, MD, MPH
Trissa Torres, MD, MSPH, FACPM