
2020 County Health Rankings Key Findings - Interactive Diagram
View the 2020 Key Findings Report
Every County has Room for Improvement
Ranking counties on health factors and outcomes calls attention to the fact that place matters, and, from one county to the next, there are meaningful differences in the opportunity to be healthy. Data show not only large differences across counties, but also striking differences within counties. Even within the top-ranked county of each state, there are gaps in opportunities that keep people from being their healthiest. These gaps exist in some form across all U.S. communities and point towards deeply rooted and unfairly structured barriers to economic opportunity, such as residential segregation, discriminatory practices in housing and bank lending, or tax policies that exacerbate the wealth divide.
In the interactive graphic below, you can see how rates of children in poverty differ by race and ethnicity, and the magnitude of income inequality between the highest and lowest quintile of earners within counties. Use the scroll bar to see data for 3000+ counties or use the State and County drop-down menus to narrow the results. Children in poverty data can also be filtered by race and ethnicity to see only one group’s values or highlighted to more clearly see how one group compares to the rest.
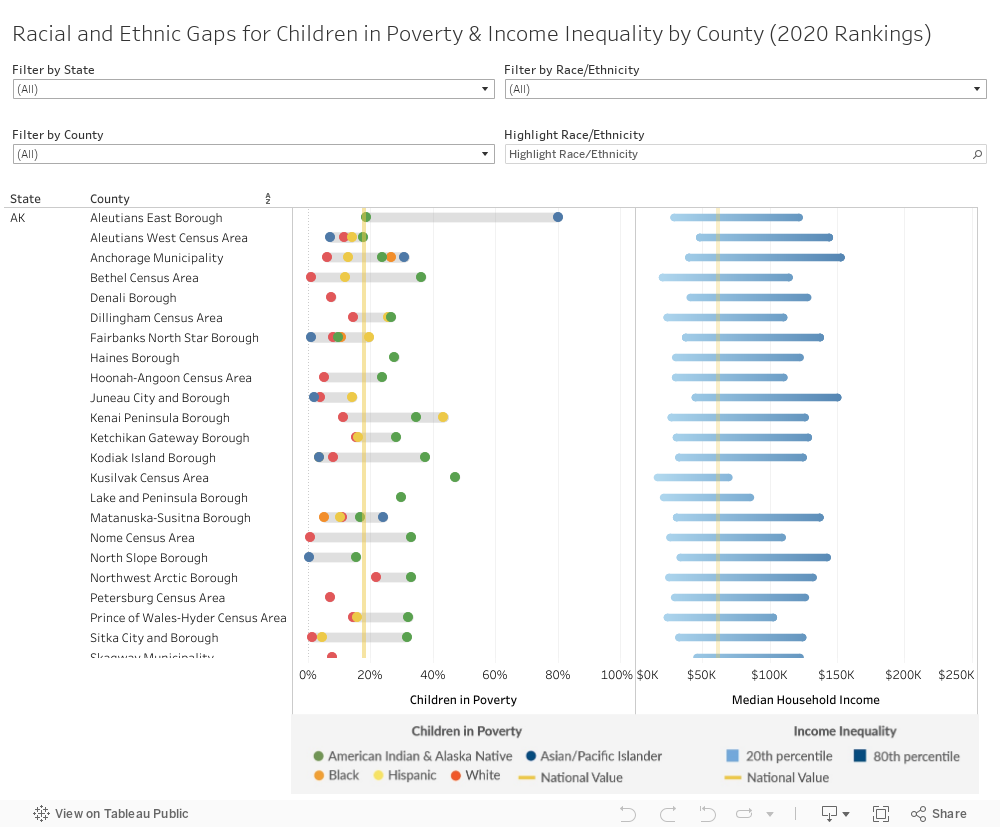
Notes: Extreme and missing values for Children in Poverty can occur in counties with small sub-group populations. Values with 95% confidence intervals widths >40% were suppressed. See analytic files for unsuppressed values and 95% confidence intervals.
This interactive graphic is a supplement to the 2020 County Health Rankings Key Findings Report.
Recommended citation: University of Wisconsin Population Health Institute. County Health Rankings Key Findings 2020.