
About the Compare Counties Tool
The County Health Rankings & Roadmaps Compare Counties Tool offers several options for comparing a county to other locations. This tool may be used for goal setting, identification of county strengths and areas for improvement, or to learn more about a county’s health experience within the context of similar locations. Use the Compare Counties Tool to compare individual counties or to compare a county to all other counties in the state, nation, or with similar rural or urban characteristics. The methods used to summarize state values, national values and similar rurality are described below.
State Value
The state value highlights how similar or different the selected county’s health outcomes and health factors are compared to all other counties in the same state.
Methods
For most measures, the state value is a population-based calculation representing all counties in the state or is provided by the data source.
Exceptions to this methodology include:
- state values for the measures of Air Pollution - Particulate Matter, Child Care Centers and Child Care Cost Burden which are represented by the median of all county values in the state;
- state values for the measure of Limited Access to Healthy Foods, which are aggregate census tract-level data;
- state values for the measure of Food Environment Index, which are set relative to the national distribution of county values; and
- measures of Adverse Climate Events, Census Participation and Drinking Water Violations, which do not have state values.
National Value
The national value highlights how similar or different the selected county’s health outcomes and health factors are compared to all other counties in the nation.
Methods
For most measures, the national value is a population-based calculation representing all counties in the U.S. or is provided by the data source. Exceptions to this methodology include:
- national values for the measures of Child Care Cost Burden and Child Care Centers, which are represented by the median of all county values;
- national values for the measures of Air Pollution - Particulate Matter, Diabetes Prevalence, Insufficient Sleep, Math Scores, Reading Scores, Residential Segregation - Black/White, School Segregation, and Traffic Volume are represented by the median of state values;
- national values for the measure of School Funding Adequacy, which are calculated as the median value of school districts;
- national values for the measure of Limited Access to Healthy Foods, which are aggregate census tract-level data;
- national values for the measure of Food Environment Index, which are set relative to the national distribution of county values; and
- measures of Adverse Climate Events, Drinking Water Violations and Living Wage, none of which have national values.
Similar Rurality
The similar rurality comparator highlights how similar or different the selected county’s Community Conditions and Population Health and Well-being are compared to all other counties with similar rural or urban characteristics. Rural areas can be found across the U.S., each with unique histories, populations and geography. Comparison of Community Conditions and Population Health and Well-being to other counties with similar population density and proximity to urban areas may be used to inform reasonable goals for health measures and further contextualize the health experience of the selected county.
Methods
The Compare Counties Tool allows users to select a county and compare each measure to the median for U.S. counties classified as being similarly rural (similar rurality is defined in this tool as having the same Rural-Urban Continuum Code (RUCC)). It is important to note that County Health Rankings & Roadmaps uses distinct rural-urban classification systems in other tools and resources.
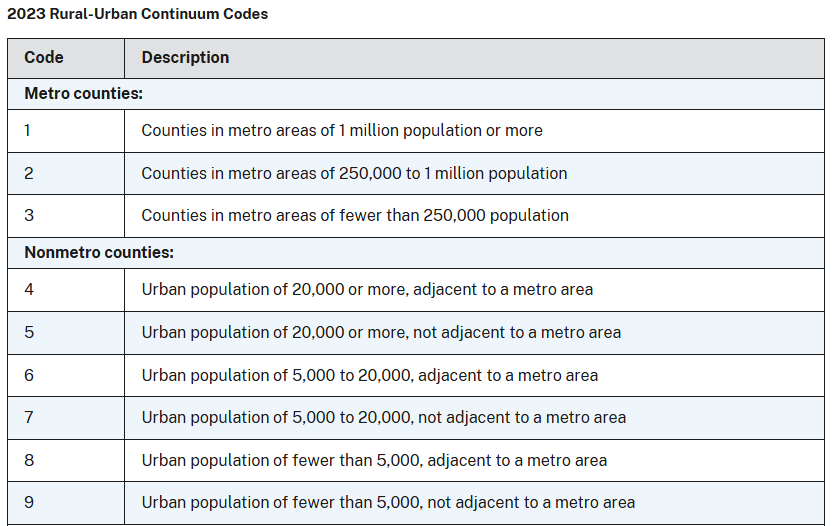
The U.S. Department of Agriculture (USDA) Economic Research Service (ERS) developed the RUCCs to classify counties into one of nine classes according to level of rurality or urbanicity. The classification builds on the Office of Management and Budget’s (OMB) metropolitan and non-metropolitan classification, and further divides metropolitan counties by population size and non-metropolitan counties by “degree of urbanization” and adjacency to metropolitan areas.1 A metropolitan area is a region that includes a core area with a large population and adjacent areas that are economically and socially integrated with the core.2
Metropolitan counties are counties within an OMB-defined metropolitan statistical area (MSA). An MSA can contain multiple counties and must have at least one census-defined urban area with a population greater than 50,000.3 The RUCCs divide these metropolitan counties into three classes based on the population size of the corresponding MSA.4
Nonmetropolitan counties are counties that are not within an OMB-defined MSA. The RUCCs divide these counties into six classes based on urban population size categories (size of population in census-defined urban areas) and on adjacency to one or more MSA.4
Please note that Connecticut data are assigned to legacy counties using 2013 RUCCs. For more information and documentation on RUCCs, visit the USDA website.
Strengths
The nine codes included in the RUCCs provide more detail than a binary urban/rural classification, such as the census’ classification, which defines rural as areas that are not within a census-defined urban area,5 or the OMB’s metropolitan/nonmetropolitan classification in which non-metropolitan counties are often designated as rural. The RUCCs combine elements of the census and OMB classifications. These are the two most frequently used classifications for researching and analyzing data on rural populations. The RUCC classifications incorporate elements of population size with the social and economic dynamics that connect open lands, smaller towns and urban places.
Limitations
There may be rural and urban places located within the same county, and county-level rural classifications do not communicate this heterogeneity within counties. It may be difficult to identify the locations of rural populations and their needs if they are within a county that also contains urban populations.
Sources
- U.S. Department of Agriculture (USDA), Economic Research Service (ERS). Rural-urban continuum codes. 2024. https://www.ers.usda.gov/data-products/rural-urban-continuum-codes/
- U.S. Census Bureau. About. 2023. https://www.census.gov/programs-surveys/metro-micro/about.html
- Federal Register. 2020 Standards for delineating core based statistical areas. 2021. https://www.federalregister.gov/documents/2021/07/16/2021-15159/2020-standards-fordelineating-core-based-statistical-areas
- U.S. Department of Agriculture (USDA), Economic Research Service (ERS). Documentation. 2024. https://www.ers.usda.gov/data-products/rural-urban-continuum-codes/documentation/
U.S. Census Bureau. Urban and rural. 2023. https://www.census.gov/programs-surveys/geography/guidance/geo-areas/urban-rural.html