
Measuring Progress & Change
How do you know if your county’s health is improving or declining? Combine several pieces of information to get the whole picture. Progress that you make now can take years to show up in data. You can look at trends over time for your county to see your progress toward health.
Progress can take time to show up in data
Change is a long and complex process. It’s important to be realistic about how quickly change happens and how quickly those improvements might show up in the data.
For example:
- When law makers pass a law limiting tobacco advertising, smoking rates may decline over time. It will take additional time before this reduction in adult smoking rates leads to fewer deaths caused by lunch cancer.
- When voters and other decision makers implement budget changes to fund early childhood education, it can close achievement gaps for children entering kindergarten and eventually increase high school completion rates as the group of children progress through elementary and secondary school.
Furthermore, most data collection (via census or survey) has lag times. For example, our premature death rates represent a lag of more than three years, and to be sure that we have reliable data for communities of all sizes, we use three years of data. So, the Premature Death rates you see in the current county health dataset reflect premature deaths from three to six years ago. As you look at your county data, make sure to keep an eye on the years of data used for each measure.
Trends over time can indicate change
Examining changes in health outcomes over time can provide an overall sense of community progress toward health. Trends in health factors can inform specific health programs and may reflect the impact of local efforts.
We provide trend graphs for many measures, which are available within your county snapshot.
Each graph icon is color-coded to communicate the direction of the trend:
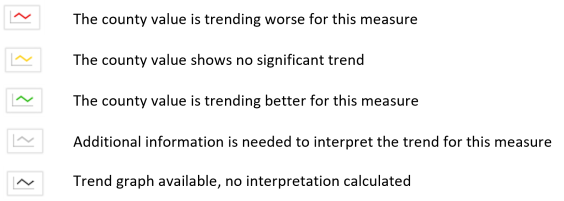
These questions can help guide interpretation of the trend graphs:
- Is the county value increasing, decreasing or staying the same over time?
- Is the county trend better, worse or similar to the state trend?
- Is the county trend better, worse or similar to the national trend?
- What worldwide, national or local events occurred during this time period that may have impacted the measure? What changes to national, state or local policies or norms may have contributed to this trend?
Download our guide to interpreting trend graphs for additional guidance.