
Children living in poverty even in healthiest counties
Nearly 1 in 10 children live in poverty in the healthiest counties. Black, Hispanic and Native American children are disproportionately burdened, often experiencing poverty at rates at least twice those of white children.
Poverty can be overlooked in healthy counties where averages hide the experiences of those who are being excluded from opportunities to thrive. In nearly all counties where data are available, a greater share of Black, Hispanic, and Native American children live in poverty.
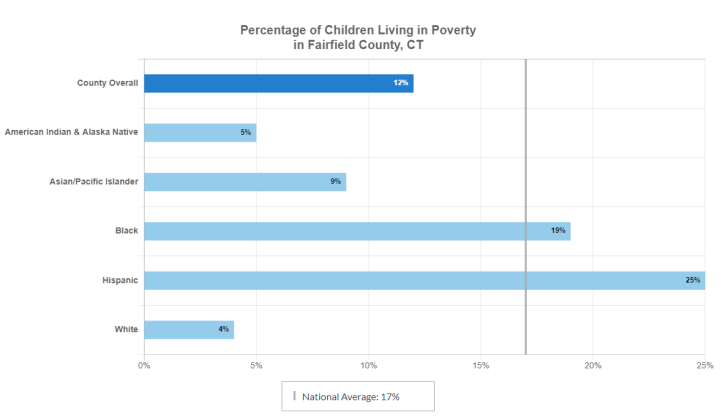
For example, Fairfield County in Connecticut is one of the healthiest counties in the nation. But when you look deeper, it’s clear that large gaps exist in the percentage of children living in poverty between racial and ethnic groups. This range spans 4% to 25%, varying by racial and ethnic groups. These gaps show us that not all children in this community have the same opportunities to live long, healthy lives.
Explore differences in poverty rates by race in the healthiest counties nationwide
Disparities in the percentage of children living in poverty by race and ethnicity exist across the nation, including nearly all the healthiest counties.
Click or hover to see data for the healthiest county in each state.
Explore children in poverty data for your county
Children live in poverty even in healthiest counties
Nearly 1 in 10 children are living in poverty in the nation’s healthiest counties and children of color, particularly Black, Hispanic and Native American children, are disproportionately burdened. Substandard housing, unsafe neighborhoods and scarcity of quality education are often tied to living in poverty, despite the surrounding wealth in these counties.
Centuries of structural racism and ongoing discrimination lie at the root of the disparities, which can be found in healthy and often wealthy areas across the country. Evidence shows that eliminating inequities in all counties — regardless of the opportunities for some — improves the lives of all residents.
Averages hide inequities
Poverty can be overlooked in healthy counties where averages can hide the experiences of those who are being excluded from opportunities to thrive. In nearly all counties where data are available, a greater share of Black, Hispanic, and Native American children live in poverty.
In Fairfield County in Connecticut, for example, the overall percentage of children in poverty is 12% — 5% lower than the national average. Yet the burden of poverty is not shared evenly among children of all racial and ethnic groups. According to CHR&R data for this county, which is considered among the healthiest in the nation:
- 1 in 4 Hispanic children live in poverty
- Almost 1 in 5 Black children live in poverty
- Fewer than 1 in 10 white or Asian children live in poverty
Disparities exist in the healthiest county in nearly all 50 states, even though the percentage of children living in poverty is lower than the national average in all but three. The averages may obscure troubling patterns. When children within a county live widely varied experiences, county-level averages can hide the need for action.
Strong link exists between poverty and health
CHR&R ranks counties to determine how healthy they are based on the length and quality of life in the community. It often follows that counties whose residents are wealthier have more opportunities to live long, healthy lives. By contrast, children experiencing poverty lack opportunities to live in safe homes and in well-resourced neighborhoods, and to receive quality education.
About 17% of children — or 1 in 6 — live in poverty across the country. These children may experience lasting effects into adulthood on academic achievement, health, and income. They are also at increased risk for injuries and are more susceptible to chronic conditions such as asthma and diabetes.
The federal government calculates the poverty threshold for a family of four at $26,500 annually. The number considers the amount it costs for essential needs such as food and housing. However, the poverty line remains the same regardless of whether a family lives in San Francisco or Topeka, Kansas.
Racism and discrimination are at the root
These avoidable inequities emerge from discriminatory practices and policies embedded in education, employment, housing, transportation, and urban and regional planning. For those living in the same county, institutional practices may also influence differences in living conditions and opportunities to thrive.
By working together, local communities can remove barriers and create a more equitable future. Explore resources and strategies to advance equity below.


Technical Notes:
- This Data Spotlight uses 2021 County Health Rankings data.
- Fairfield County, Connecticut was selected as a representation of the healthiest counties in the nation. It is the healthiest county in Connecticut, which is the healthiest state (per America’s Health Rankings 2020) that also included reliable data on children living in poverty available for all five racial and ethnic groups.
- The healthiest county in each state was identified as the healthiest ranked county over the average of the 2019-2021 County Health Rankings for which reliable data was available for at least two racial/ethnic groups.
- The overall county estimates of children living in poverty come from the Small Area Income and Poverty Estimates (SAIPE) program. Estimates of children living in poverty by racial and ethnic groups come from the American Community Survey using combined five-year estimates.
- Extreme and missing values for children in poverty can occur in counties with small sub-group populations. Values with 95% confidence intervals widths >40% were suppressed.