
Juvenile Arrests*
About
Rate of delinquency cases per 1,000 juveniles. The 2024 Annual Data Release used data from 2021 for this measure.
Juvenile arrests can illustrate one aspect of the complex societies in which youth live. Juvenile arrests are the result of many factors such as policing strategies, local laws, community and family support, and individual behaviors. Youth who are arrested face disproportionately higher morbidity and mortality. Those who are arrested and incarcerated experience lower self-reported health, higher rates of infectious disease and stress-related illnesses, and higher body mass indices.1-3
Juvenile Arrests measures provides an opportunity for conversation around youth and the justice system. This measure offers more context than just convictions, as convictions account for only 30% of juvenile arrests, and the act of an arrest itself has significant effects on the individual and the community.4
Data and methods
Data Source
Easy Access to State and County Juvenile Court Case Counts
Easy Access to State and County Juvenile Court Case Counts (EZACO) gives users quick access to state and county juvenile court case counts for delinquency, status offense, and dependency cases.
Key Measure Methods
Juvenile Arrests is a rate
Juvenile Arrests is the number of delinquency court cases per 1,000 juveniles in a county. Rates measure the number of events in a given time period (generally one or more years) divided by the average number of people at risk during that period. Rates help us compare risks of health factors across counties with different population sizes.
Crimes are counted where they are committed rather than based on the residence of the persons involved
Crimes are counted in the court jurisdiction where they occur, rather than the residence of the juvenile.
Caution should be used when comparing these estimates across states
Juvenile Arrests may vary across states due to different reporting practices, arrest rules and laws, as well as different juvenile age limits. Additionally, some states report calendar year estimates while other states use fiscal year estimates.
Juvenile Arrests should be compared with caution across counties
Different agencies are responsible for reporting arrests and court cases in different jurisdictions. Estimates are suppressed where case counts are between 1-4, which could greatly impact estimates in small counties. In addition, even within states, petitioned and non-petitioned cases might be missing due to reporting differences by county. Juvenile Arrests sums the total petitioned and non-petitioned cases for the numerator. Petitioned and non-petitioned cases can be differentially reported either within or across a state(s). Thus, we strongly suggest consulting state-specific documentation from EZACO when considering comparisons between counties, even within a state.
Measure limitations
As noted above, the rate of juvenile arrests is only one piece of information to be used when trying to understand the relationship between the judicial system and health among youths. This measure is intended to begin the conversation, but we urge caution when comparing rates between counties, as both arrest and reporting practices can differ among jurisdictions. We suggest before drawing conclusions or using these data for interventions to consult with either law enforcement or related agencies in your current jurisdiction or EZACO to properly understand how the data are gathered for your state and jurisdiction.
Here is a graphic displaying the many different outcomes for juvenile court processing from the Office of Juvenile Justice and Delinquency Prevention 5:
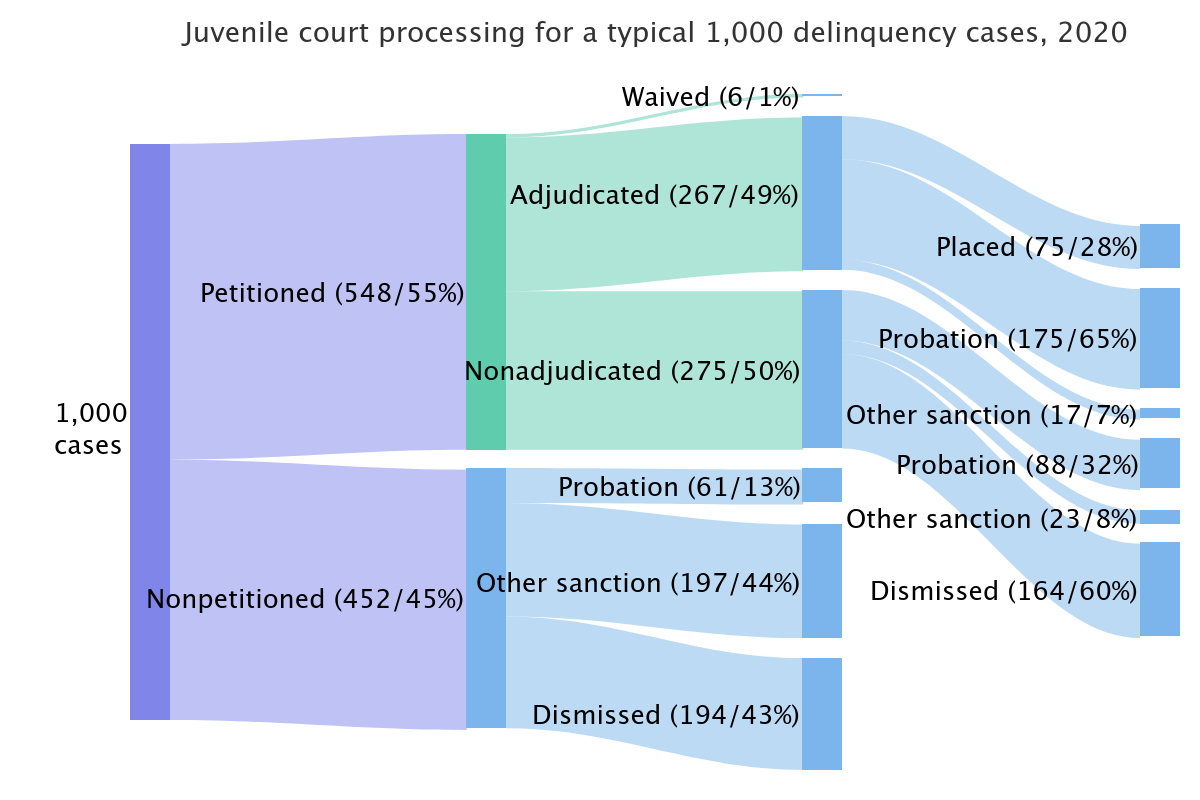
Of note, because of known reporting differences by counties in Illinois and Ohio, only petitioned cases are included in the numerator for the rates in these states even though data is provided for select counties. Data for Cook County, IL is provided by the Juvenile Court of Cook County, while the data for the other 101 counties are provided by the Annual Report of Illinois Courts who do not report non-petitioned cases. Similarly, in Ohio, data for Cuyahoga, Franklin, Hamilton and Lucas counties are provided by the Cuyahoga County Juvenile Court, Franklin County Court of Common Pleas, Hamilton County Juvenile Court, and Lucas County Juvenile Court respectively while all other counties are reported by the Supreme Court of Ohio.
This measure is not available in all states. This is typically because a state did not report data to EZACO and does not have data in their annual reports, a state did not submit data, or a state did not approve release of their data in time for publication. Please see CHR&R’s FAQ for more information about this.
Numerator
The numerator is the number of delinquency cases formally processed in juvenile court (petitioned) and the number of delinquency cases informally handled (non-petitioned) for individuals ages 0 to the upper age of jurisdiction for a juvenile court.
Non-petitioned cases often result in dismissal or informal sanctions such as fines, community service, informal probation, or referral to a social services agency. Petitioned cases could also be dismissed, but the accused juvenile offender still has their case processed by a juvenile court judge before determining their decision.
The upper age in which a juvenile court has jurisdiction is 17 for all states except for New York and North Carolina (15 years) and Georgia, Missouri, Texas, and Wisconsin (16 years). It is important to note that the numerator is cases and not offenders as a juvenile could have multiple delinquency violations.
Denominator
The denominator is the population ages 10 to the upper age of jurisdiction. The upper age is 17 for all states except for New York (15 years) and Georgia, Missouri, Texas, and Wisconsin (16 years). The population value is rounded to the nearest 100. The age range of 10 to upper age is used because 99.4% of all juvenile arrests occur among those who are 10 and older.1
Can This Measure Be Used to Track Progress
This measure can be used to track progress with some caveats. It is important to be aware of law changes in the county of interest. It is also important to note the methodological changes that may have occurred in your jurisdiction when comparing across years.
Finding More Data
Data is unavailable in most cases by specific subgroups. However, often state Offices of Justice report similar arrest data for other geographies, by gender and race/ethnicity, or by type of crime committed.
References
1 Massoglia M. Incarceration as exposure: The prison, infectious disease, and other stress-related illnesses. Journal of Health and Social Behavior. 2008;49(1):56-71.
2 Massoglia M, Remster B. Linkages between incarceration and health. Public Health Reports. 2019;134(1):8S-14S.
3 Houle B. The effect of incarceration on adult male BMI trajectories, United States, 1981-2006. Journal of Racial and Ethnic Health Disparities. 2014;1(1):21-28.
4 Chisolm DJ. Justice-involved youth: The newest target for health equity approaches? Pediatrics. 2017;140(5):e20172800.
5 OJJDP Statistical Briefing Book. Juvenile court processing for a typical 1,000 delinquency cases, 2020. Washington, D.C.: Office of Juvenile Justice and Delinquency Prevention (OJJDP); 2023. Accessed December 26, 2023.https://www.ojjdp.gov/ojstatbb/court/JCSCF_Display.asp?ID=qa06601&year=2020&group=1&estimate=1